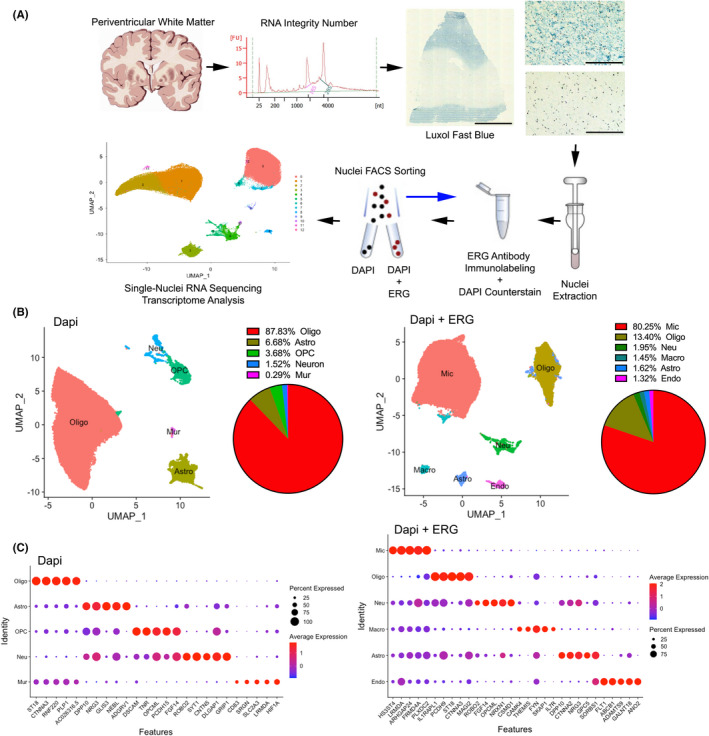
FIGURE 1.

Single‐nucleus transcriptome analysis of the PVWM in VaD. (A) Single‐nucleus transcriptome profiling workflow. Scale bar 5 mm and 200 μm. (B and C) Unbiased identification of cell‐type heterogeneity in the human PVWM. (B) UMAP plot showing the 5 (DAPI condition) and 6 (DAPI + ERG condition) major cell types isolated from PVWM and proportions of cell types among the 172,943 sampled nuclei. (C) Dot plot showing the top five most enriched genes for each cell type. See also Figures S1–S3 and Tables [Link], [Link], [Link], [Link]
