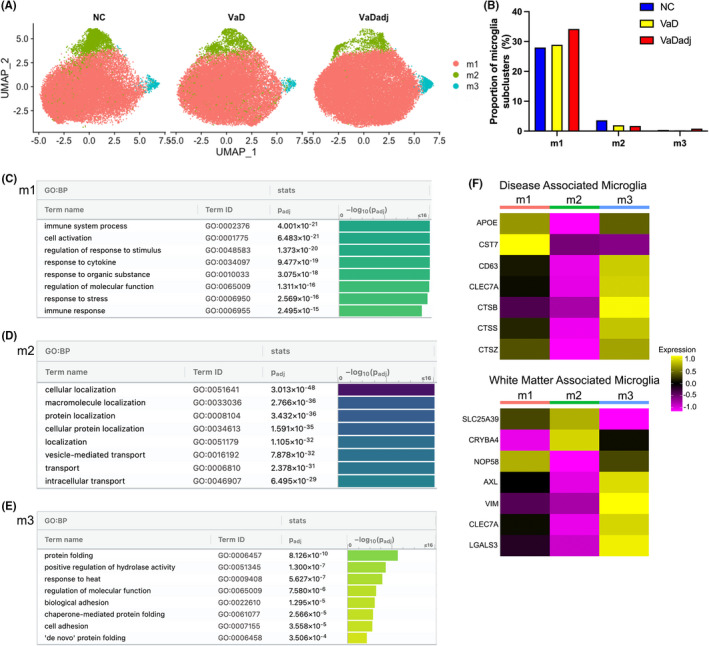
FIGURE 3.

VaD microglia subclusters show enriched genes of immune and cytokine responses and disease associated gene signature. (A) UMAP plots showing the distribution of microglia subpopulations (m1–m3) in VaD, VaDadj and NC PVWM samples. (B) Proportion of microglia subclusters. (C–E) GO pathway analysis (g:Profiler) of the transcriptome signature of microglia subclusters (m1–m3). (F) Disease‐associated and white matter‐associated microglia gene signatures. See also Tables S6 and S7
