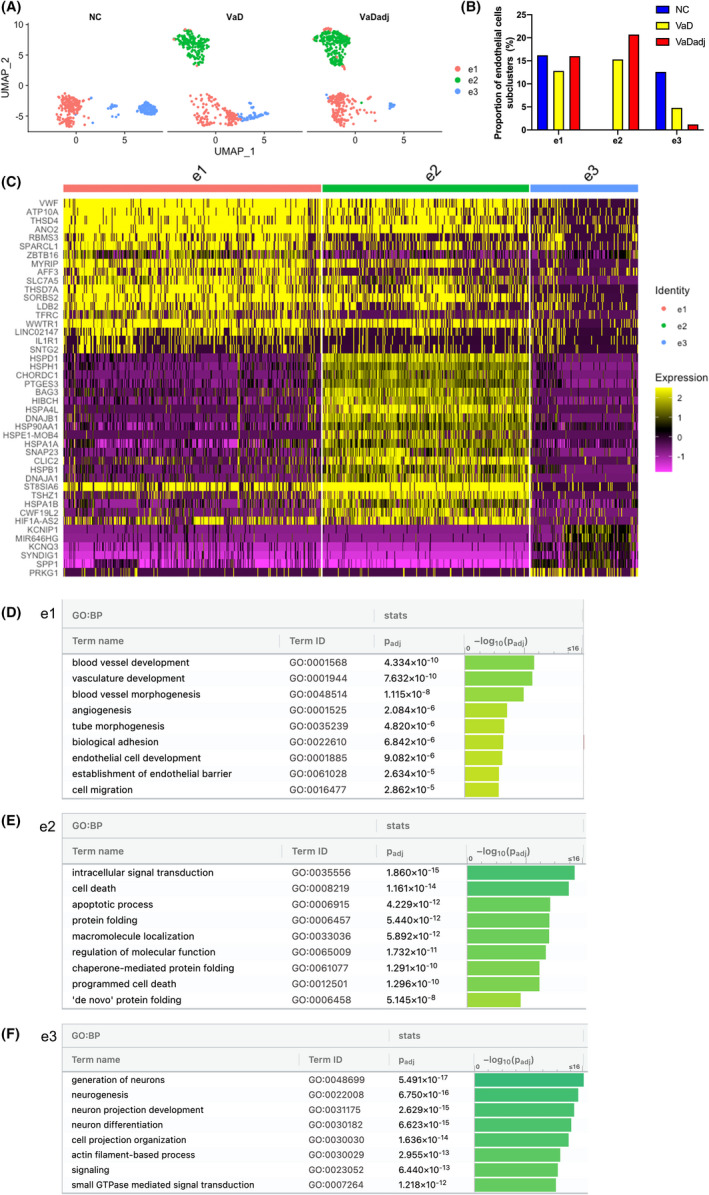
FIGURE 4.

A distinct endothelial cell subpopulation is present in VaD. (A–C) Transcriptomically unique subpopulations of endothelial cells were present in VaD samples. (A) UMAP plots showing the distribution of endothelial subpopulations (e1–e3) in VaD, VaDadj and NC PVWM samples. (B) Distribution of VaD‐associated endothelial subpopulations. (C) Expression levels of the top enriched genes in the three subpopulations at the single‐cell level (adjusted p < 0.001, log2 fold change >0.25). (D–F) GO pathway analysis (g:Profiler) of the transcriptome signature of the three endothelial cell subclusters (e1–e3). See also Tables S9 and S10
