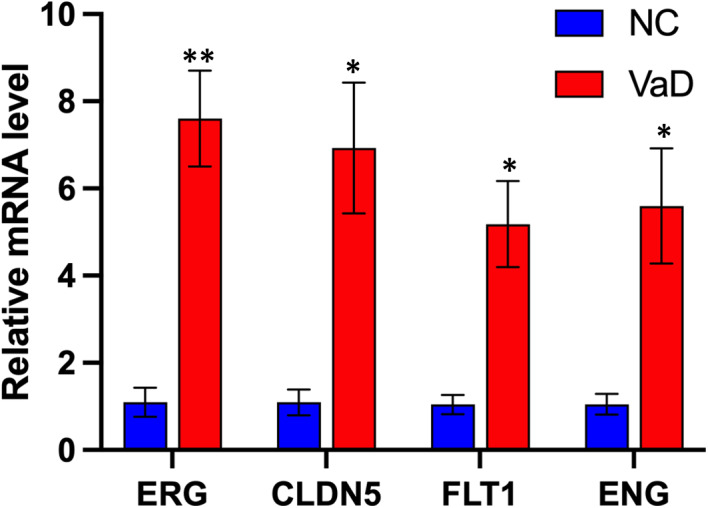
FIGURE 5.

Validation of endothelial key DEGs. Indicated genes were analysed by quantitative PCR (qPCR). Expression is shown relative to mean expression of NC (n ≥ 3, mean ± SEM, unpaired Student's t‐test, **p ERG = 0.0045, *p CLDN5 = 0.0224, *p FLT1 = 0.0174, *p ENG = 0.0432)
