
Figure 6.
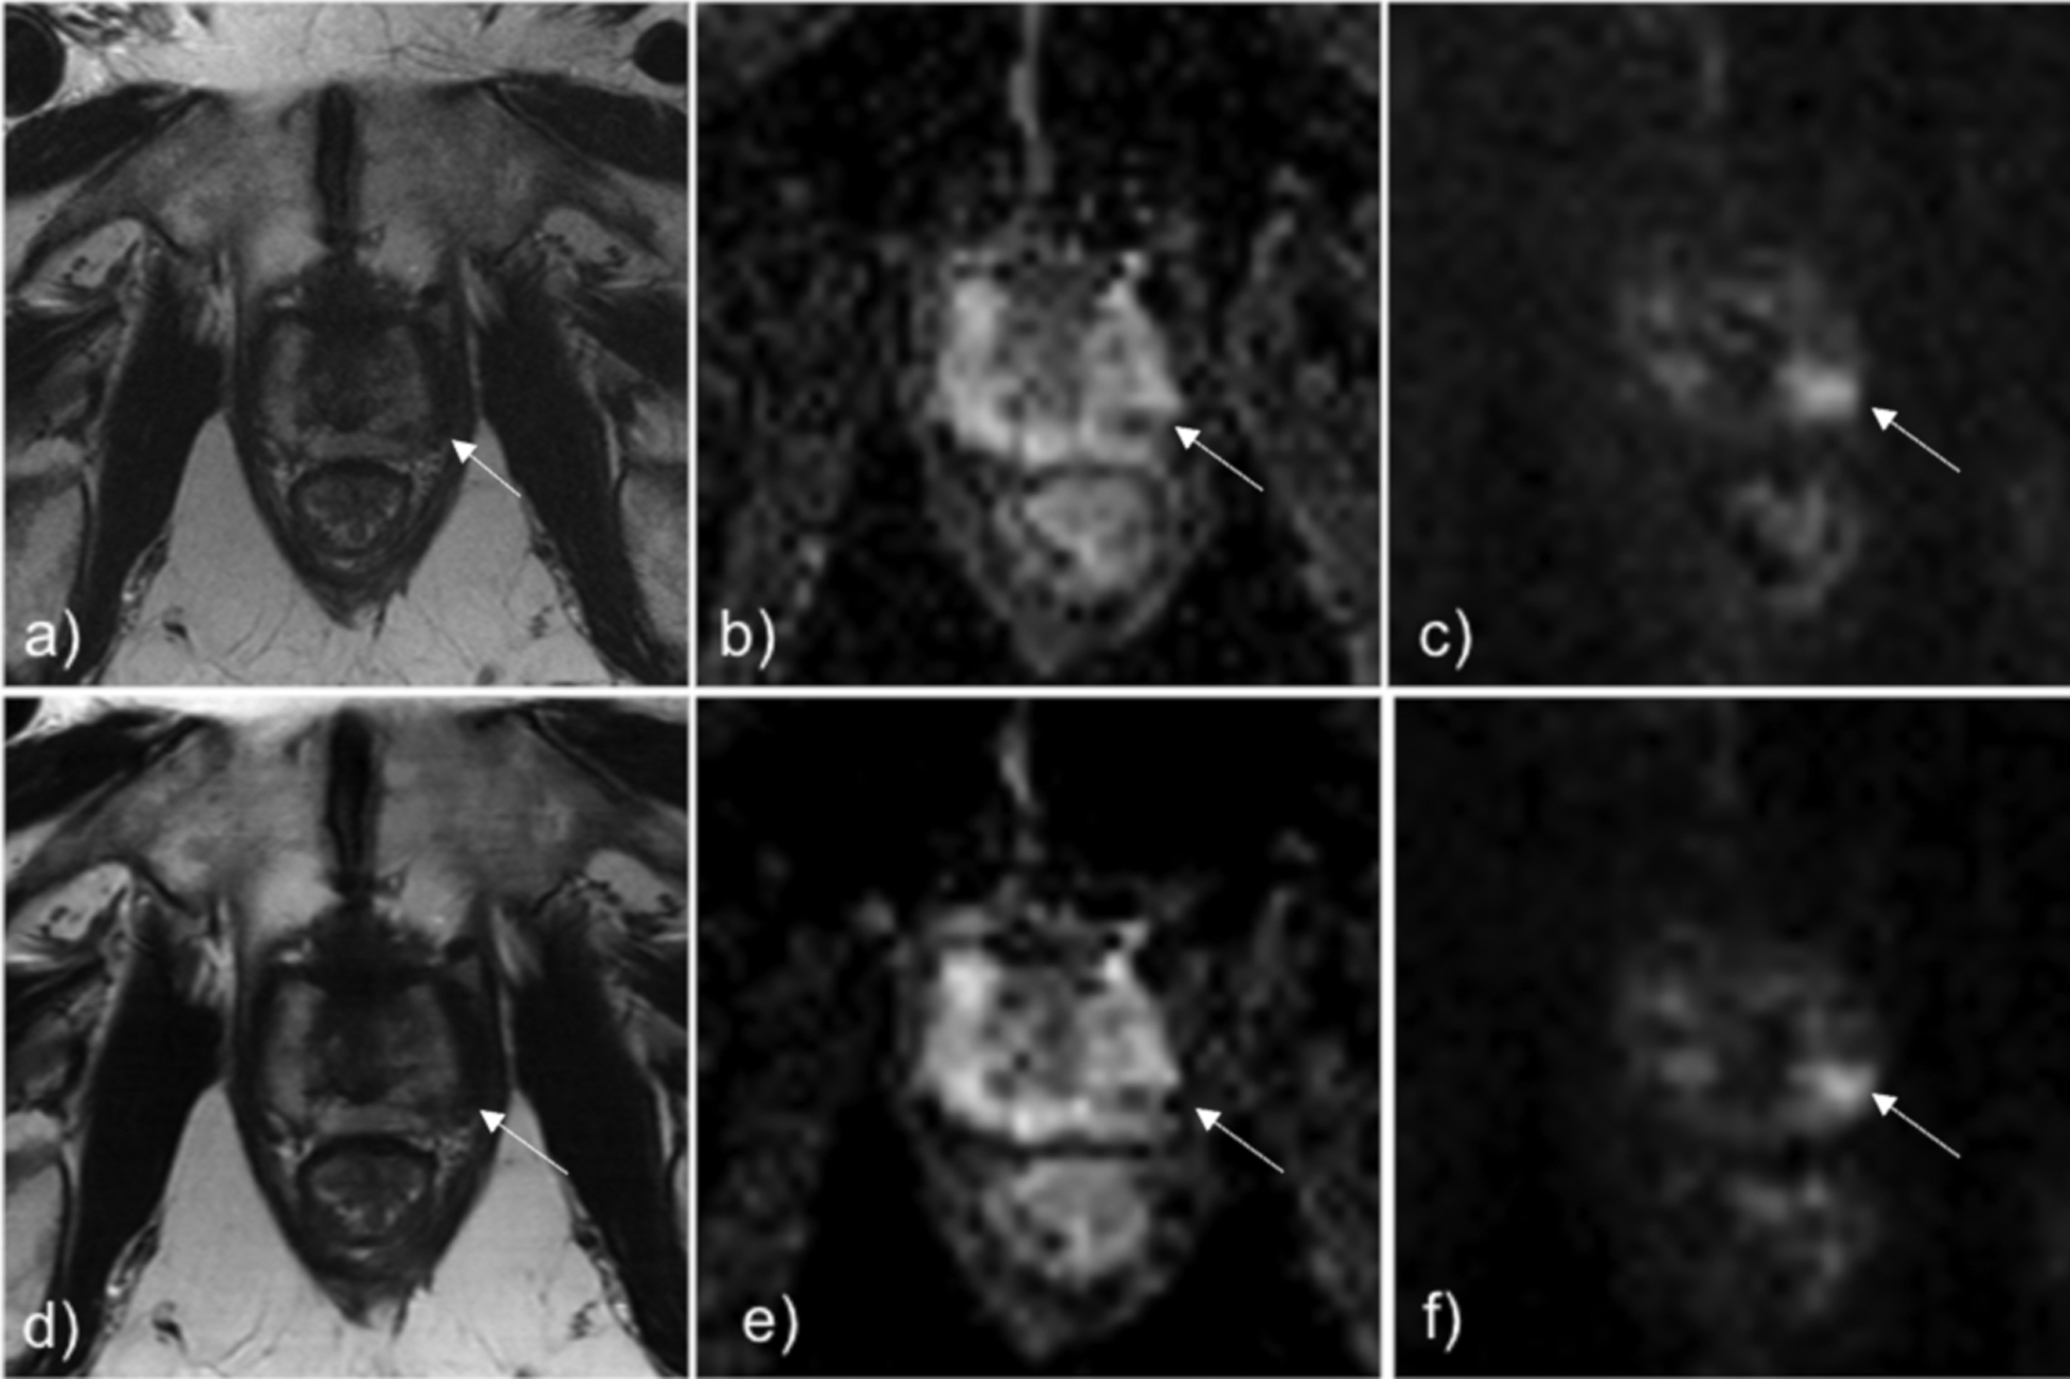
Standard T2 TSE (Fig a), ADC (Fig b), and DWI b=1500 s/mm2 (Fig c) shows lesion in the left posterolateral midgland prostate (white arrow), which was biopsied to be Gleason Grade Group 3. The same lesion can be seen identically on the DL-reconstructed T2 TSE (Fig d), ADC (Fig e), and DWI b=1500 s/mm2 (Fig f).