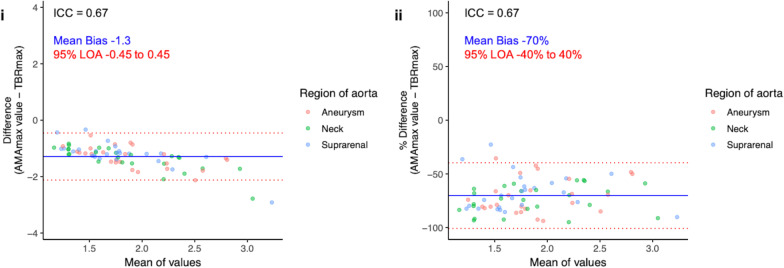
Fig. 3.
Maximum tissue-to-background ratio (TBRmax) and maximum abdominal Aortic Microcalcification Activity (AMAmax). Bland–Altmann plots with actual difference (left), and percentage difference (right) with mean bias (blue line) and 95% limits of agreement (red lines) for TBRmax and AMAmax. Y-axis limits are set to the mean of the values + 2 and − 2 and + 1% and − 1%, respectively. AMA, aortic microcalcification activity; ICC, intraclass correlation coefficient; LOA, limits of agreement; max, maximum; TBR, tissue-to-background ratio

