
Figure 3. IGRP206-214–reactive CD8 T cells exhibit characteristics of increased antigen exposure compared with IGRP206-214–nonreactive CD8 T cells.
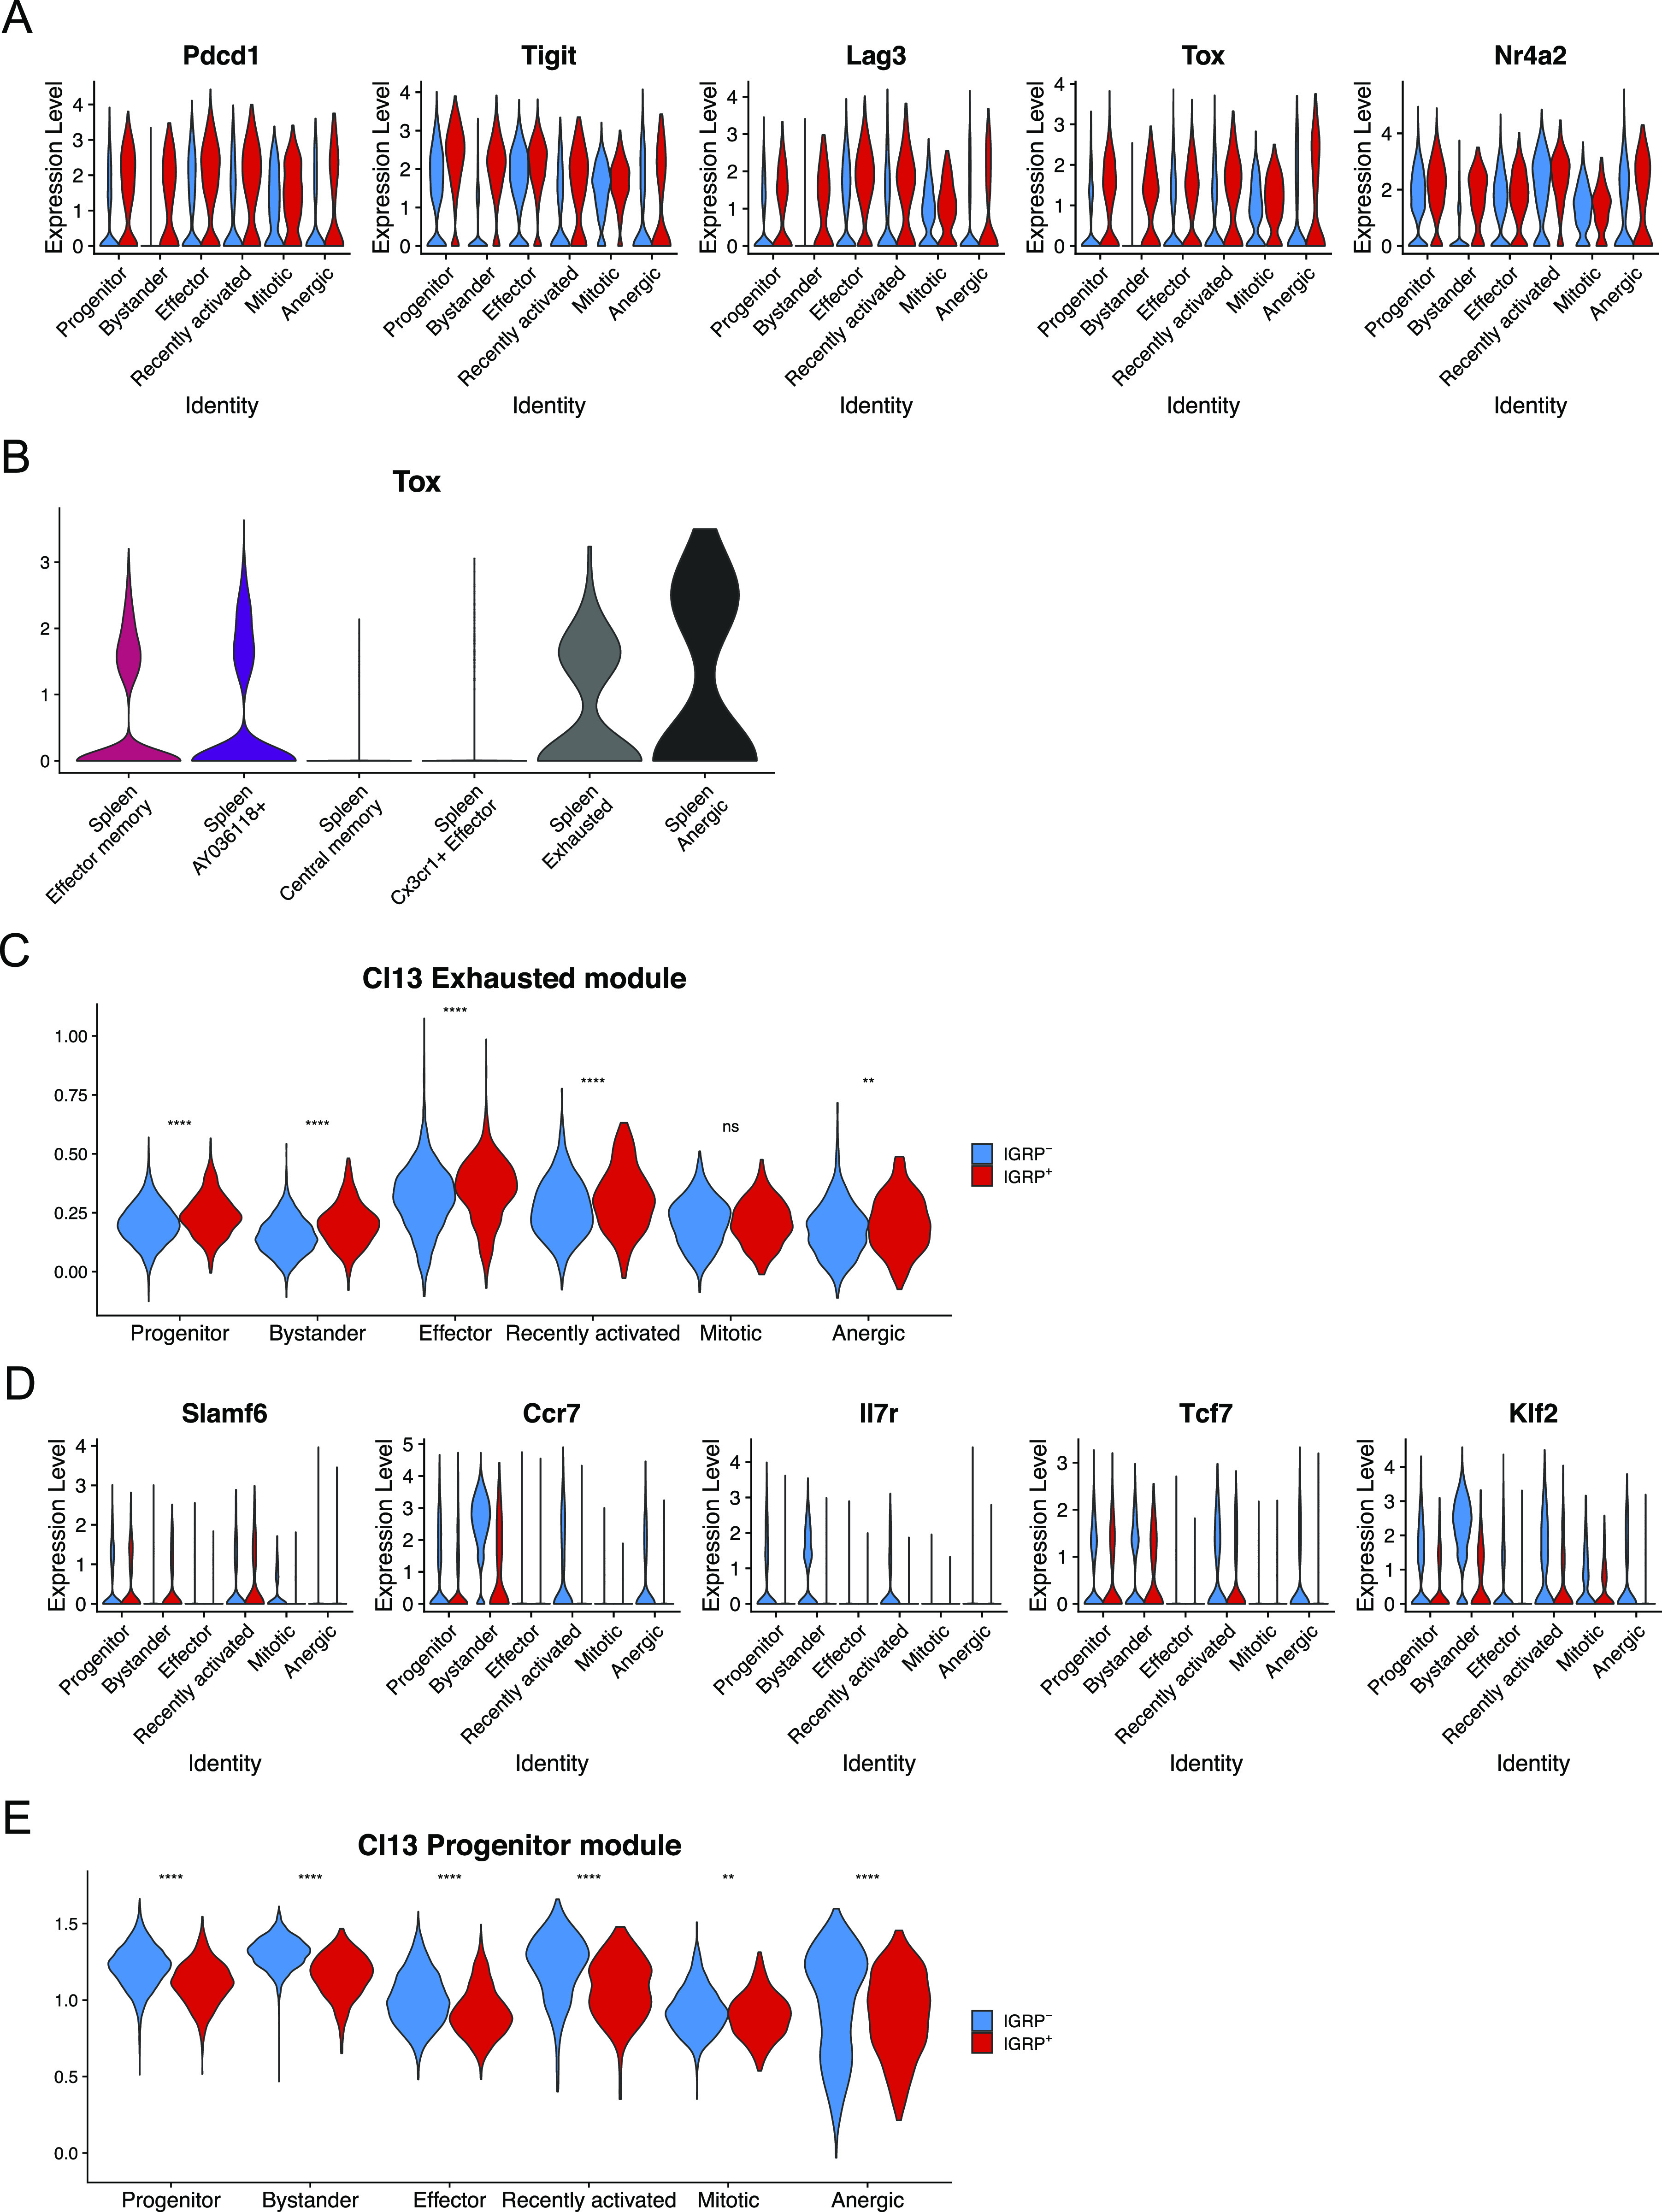
(A) Violin plots showing expression of key coinhibitory receptors, memory CD8 T cell-associated cell surface markers, and transcription factors regulating CD8 T-cell exhaustion. (B) Violin plot showing expression of Tox in spleen clusters. (C) Violin plot showing module scores of the top 100 differentially expressed genes from LCMV Clone 13 Exhausted CD8 T cells in islet CD8 T cells. Blue, IGRP206-214–nonreactive CD8 T cells. Red, IGRP206-214–reactive CD8 T cells. (A, D) As in (A) but showing markers of CD8 T-cell stemness. (C, E) As in (C), but showing module scores derived from the top 100 differentially expressed genes from LCMV Clone 13 Progenitor CD8 T cells. **P < 0.01, ****P < 0.0001 by the Wilcoxon test.