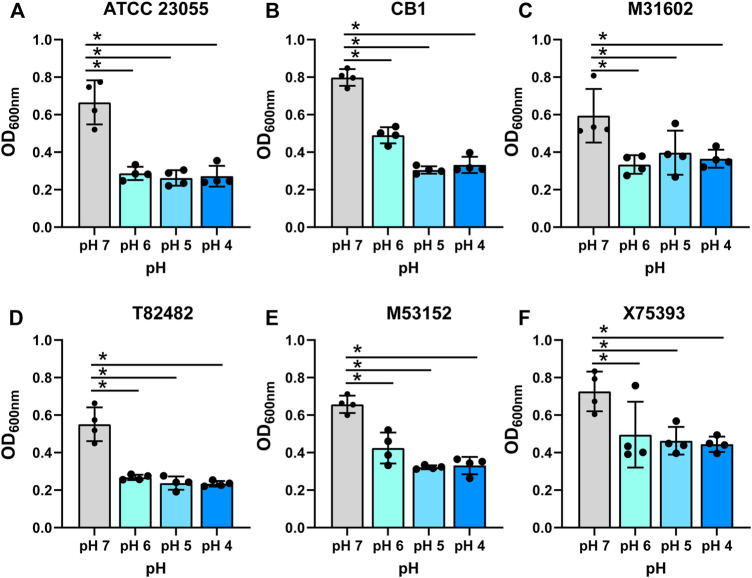
FIGURE 1.
Growth of (A) calcoaceticus in various pHs. Growth of A. calcoaceticus strains as measured by OD600nm after 18 h of incubation. Growth was examined in the following strains: (A) ATCC 23055, (B) CB1; clinical isolates: (C) M31602, (D) T82482, (E) M53152, and (F) X75,393). *p < 0.05, One Way ANOVA.

