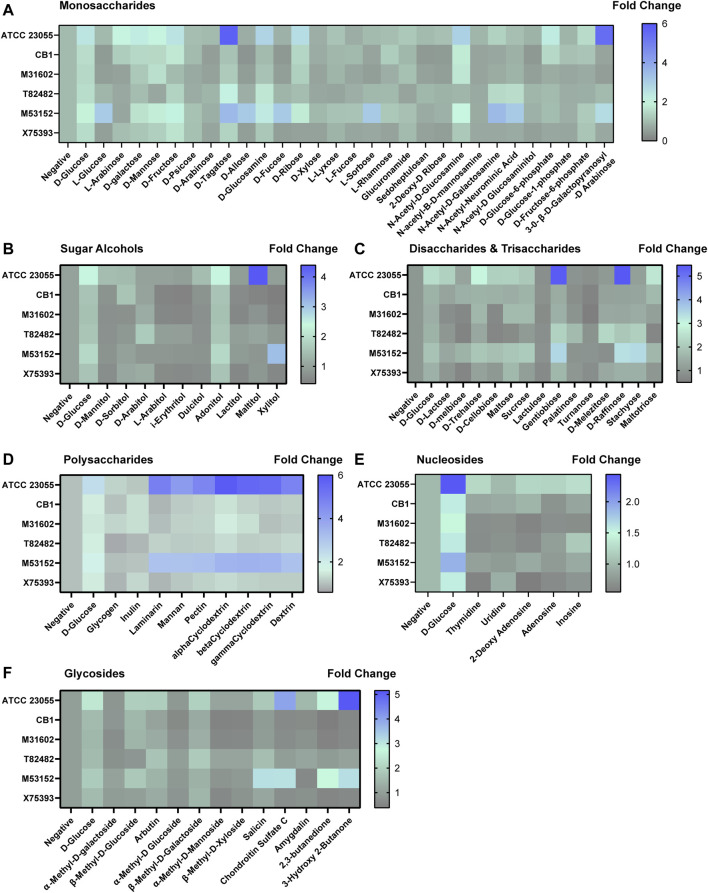
FIGURE 5.
Acinetobacter growth in varying carbon sources. Heat maps representing fold change in growth with the negative control (no added nutrients) set at 1. Growth was examined with (A) monosaccharides, (B) sugar alcohols, (C) disaccharides and trisaccharides, (D) polysaccharides, (E) nucleosides and (F) glycosides after 18 h incubation.

