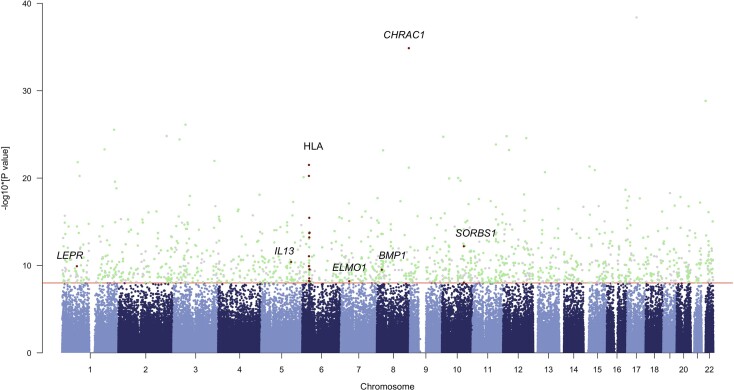
Fig. 3.
Manhattan plot of the results of the selection scans. Chromosomes are shown on the x axis, whereas the -log10(P values) from AIMLESS are represented on the y axis. Significant loci that are shared between AIMLESS, LSBL (LBK vs. Anatolia_N and HG), and XP-EHH are highlighted in green. Loci that do not overlap between the three tests are shown in gray. The loci related to immunity and metabolic pathways are highlighted in red.

