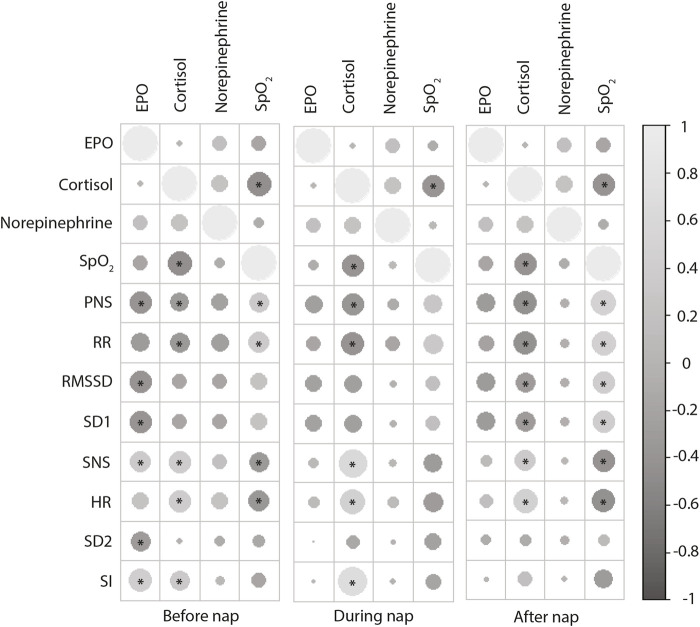
FIGURE 2.
Correlations of after nap stress hormone levels (EPO, cortisol, norepinephrine) with HRV parameters measured after, during and after the nap. Positive correlations are displayed in light gray and negative correlations in dark gray. Circle size and intensity are proportional to the correlation coefficients. *p < 0.05 (Pearson’s r).

