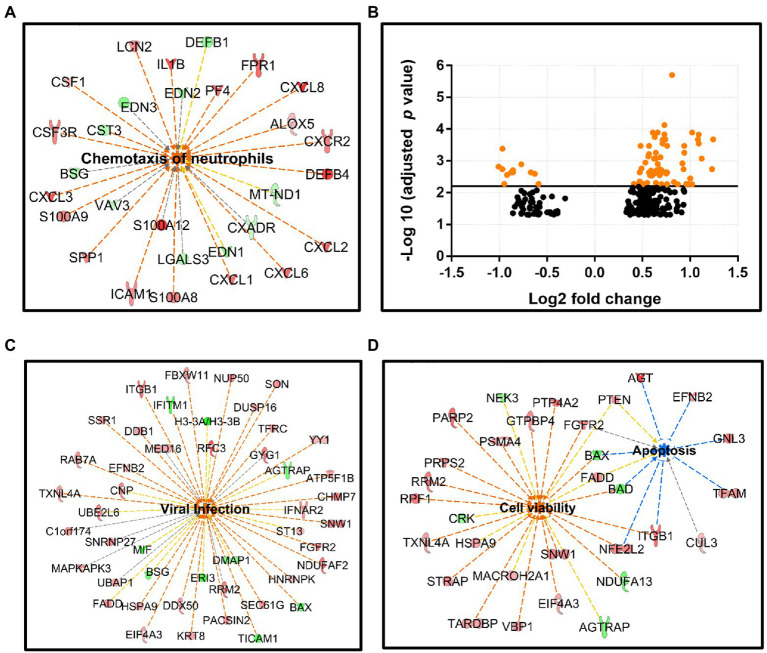
Figure 4.
RNA-seq analysis for intestinal mucosal specimens. (A) Neutrophil chemotaxis is elevated in the active sigmoid colon tissue compared to healthy sigmoid colon, this pathway involves 29 DEGs: 19 upregulated (red nodes) and 10 downregulated (green nodes), value of p 1.6 × 10⁻⁸, z-score 3.6. (B) Scatter plot of the gene expression (272 DEGs) comparing B19V-DNA-positive and -negative ileum, x-axis: Log2 fold-change, y-axis: -Log10 (adjusted p value). DEGs with adjusted p values of less than 6.24 × 10⁻³ are shown as orange dots. (C,D) Ingenuity pathway on IPA platform (Qiagen) identified different cellular pathways of B19V-altered ileum; 46 DEGs were involved in viral infection (C), and 38 DEGs were involved in cell viability (26 DEGs) or apoptosis (12 DEGs; D). DEGs were identified by the Wald test for DEseq2, with Benjamini–Hochberg correction. The p values were calculated with Fischer’s exact test (right-tailed), indicating the likelihood of association between a gene set with a process. Z-score indicates the directional effect of the DEGs on a process, z-score > 0 indicates activation, z-score < 0 indicates inhibition, and z-score > 2 or < −2 is considered significant for a given process. Orange to red nodes, upregulated DEGs; green nodes, downregulated DEGs; orange dashed line, DEGs leading to activation; blue dashed line, DEGs leading to inhibition; yellow dashed line, findings inconsistent; gray dashed line, effects unknown; orange center, DEGs leading to activation; and blue center, DEGs leading to inhibition.

