Figure 2.
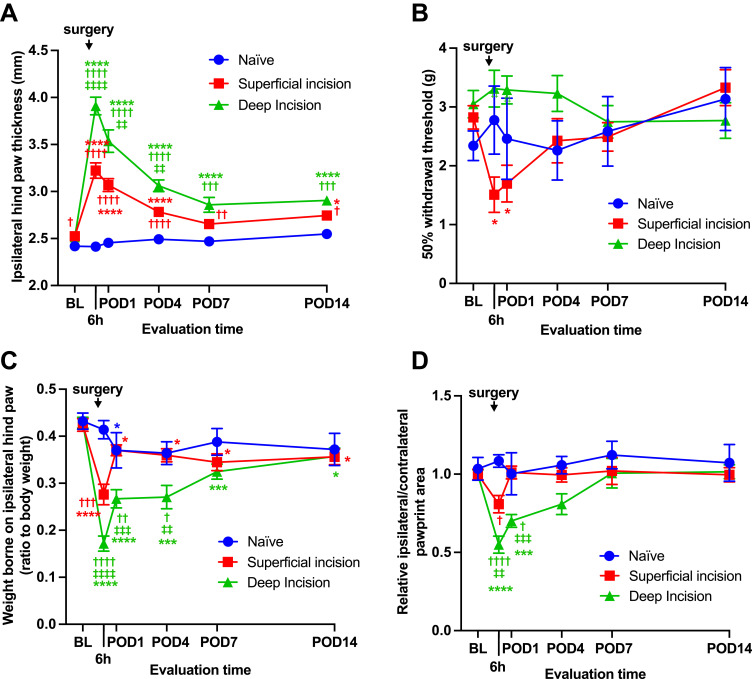
Hind paw thickness, mechanical allodynia, and weight distribution changes in different incisional pain models.
Notes: Changes were evaluated at various time points (baseline, 6 h, POD 1, POD 4, POD 7, and POD 14) in the superficial incisional pain model (n = 13) and deep incisional pain model (n = 14) compared with naïve animals (n = 5). (A) Ipsilateral hind paw thickness (mm) measured using an electronic caliper. (B) Ipsilateral paw withdrawal threshold following the von Frey filament stimulation. (C) Weight distribution ratio of the ipsilateral paw to the total body weight assessed using the advanced dynamic weight-bearing (DWB) apparatus. (D) The paw print area ratio of the ipsilateral paw to the contralateral paw was assessed using DWB. Data are expressed as the mean ± SEM, assessed by two-way ANOVA with repeated measures followed by Šídák’s multiple comparisons test. *p < 0.05, ***p < 0.001, ****p < 0.0001 vs baseline; †p < 0.05; ††p < 0.01, †††p < 0.001, ††††p < 0.0001 vs naïve; ‡‡p < 0.01, ‡‡‡p < 0.001, ‡‡‡‡p < 0.0001 deep incision vs superficial incision.
Abbreviations: BL, baseline; POD, postoperative day.

