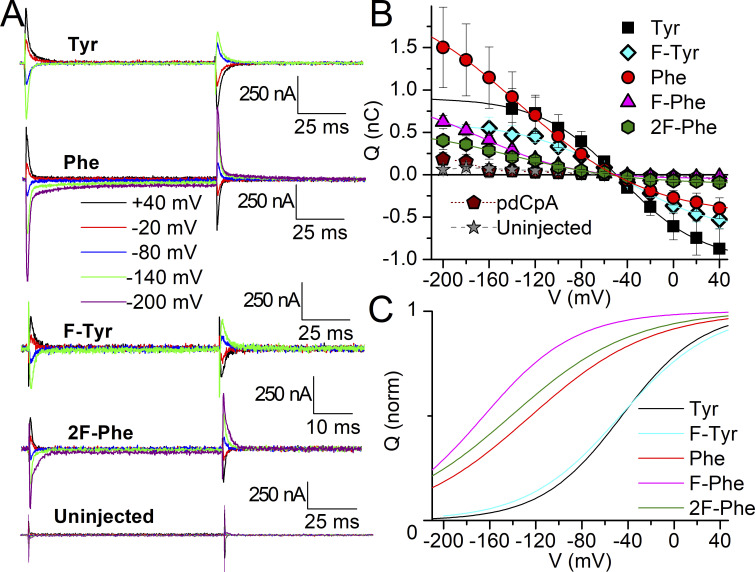
Figure 11.
Transient charge movement with unnatural amino acids at 780. (A) Ouabain-sensitive traces elicited by applying pulses from −50 mV to the indicated voltages in oocytes either uninjected or injected using the non-sense suppression method with the indicated natural and unnatural amino acids. The current scale is identical for all traces. Time scale is different only for di-m-F-Phe (2F-Phe) for which pulses were 50 ms instead of 100 ms long. (B) Mean QOFF–V curve from experiments like those in A, number of experiments (four to nine) given with mean parameters from individual experiments in the text. The line plots are fits to Boltzmann distributions (Eq. 4) to the average data with parameters: V1/2 = −45.6 mV, kT/zqe = 35.0 mV, Qtot = 1.91 nC for NSS-Tyr (Tyr); V1/2 = −136 mV, kT/zqe = 55.9 mV, Qtot = 2.65 nC for NSS-Phe (Phe); V1/2 = −46.7 mV, kT/zqe = 40.3 mV, V1/2 = −166 mV, kT/zqe = 40 mV, Qtot = 0.97 nC for p-F-Phe (F-Phe). Qtot = 1.27 nC for m-F-Tyr (F-Tyr) V1/2 = −141 mV, kT/zqe = 52.0 mV, Qtot = 0.68 nC for di-m-F-Phe (2F-Phe). Error bars represent the SEM. (C) Boltzmann fits to the average data, normalized to illustrate distinct voltage dependencies with parameters given in the text.

