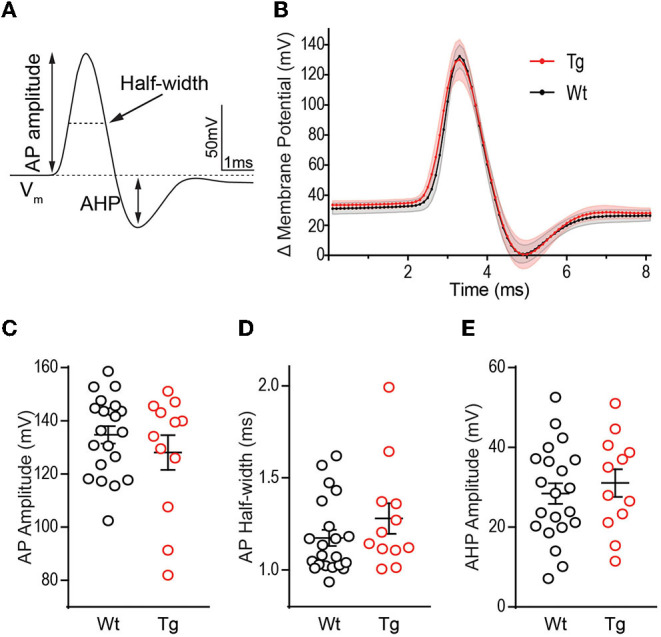
Figure 3.

Action potential waveform properties are not different between TgF344-AD and wild-type (Wt) DGCs. (A) Schematic of measurements derived from a typical action potential waveform, including, AP amplitude, half-width, and after hyperpolarization (AHP). (B) Averages of the first action potential fired at rheobase in each genotype (error bars represent scanning electron microscope (SEM)). (C) Action potential height (mV), (D) action potential half-width (ms), and (E) AHP amplitude (mV) in DGCs from 6 month TgF344-AD and Wt female rats are not different. For all panels, Wt, n = 22 cells/8 animals, Tg, n = 13 cells/6 animals, p > 0.05. Data represent mean ± SEM. Significance is determined using the unpaired Student's t-test.
