Figure 4.

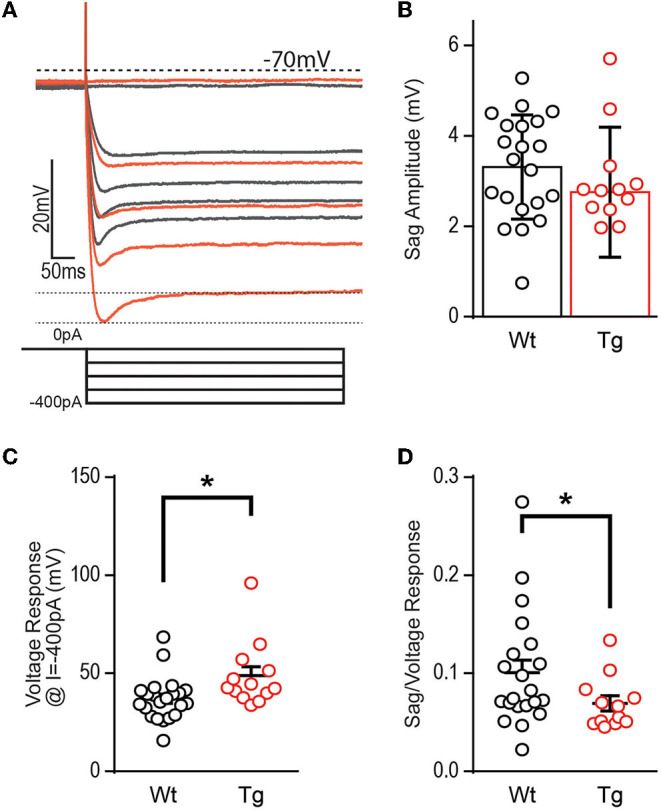
Voltage sag potential is decreased in TgF344-AD DGCs. (A) Example trace of “sag” current measurements taken at −400 pA current injection. (B) The raw amplitude of the sag current is not different between TgF344-AD and Wt littermate DGCs (Wt, n = 21 cells/8 animals; Tg, n = 12 cells/6 animals; p > 0.05). (C) The voltage response at −400 pA is greater in TgF344-AD rats (Wt, n = 22 cells/8 animals; Tg, n = 13 cells/6 animals; *p < 0.05). (D) When sag amplitude is normalized to voltage response a significant deficit in TgF344-AD DGC sag is unmasked (Wt, n = 21 cells/8 animals; Tg, n = 12 cells/6 animals; *p < 0.05). Data represent mean ± SEM. Significance is determined using the unpaired Student's t-test.
