
Figure 6.
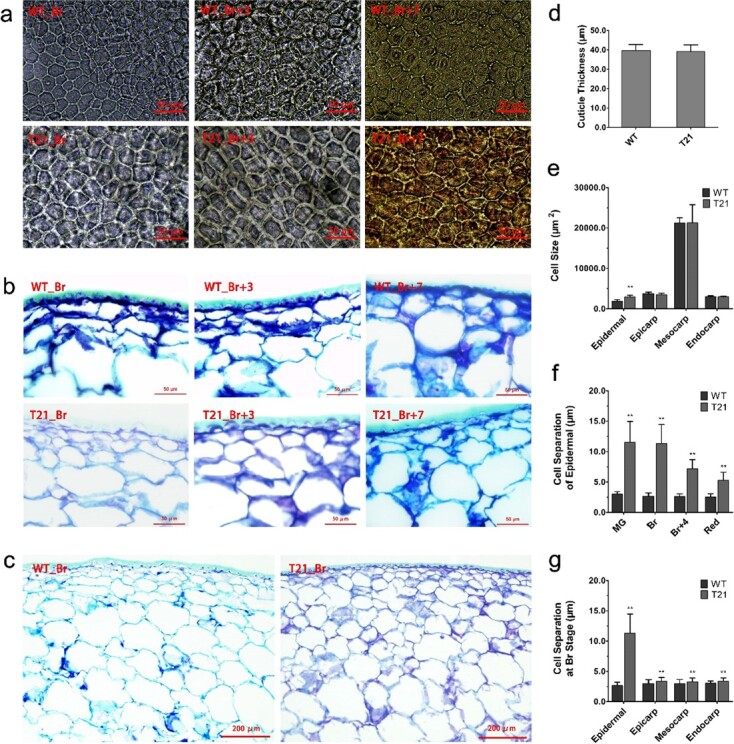
Variation of fruit pericarp cells in transgenic tomato fruits by four-gene suppression. a Epidermal cells at inner surface at Br, Br + 3, and Br + 7 stages from identical positions. b and c Histological analysis of pericarp tissue at Br, Br + 3, and Br + 7 stages. Scale bars = 50 μm (a and b) and 200 μm (c). d–g Statistical analysis of cuticle thickness (d), epidermal cell size (e), cell separation of epidermal tissue (f), and cell separation of pericarp tissue at Br stage (g). T-21, transgenic line; **P < .01 by t-test.