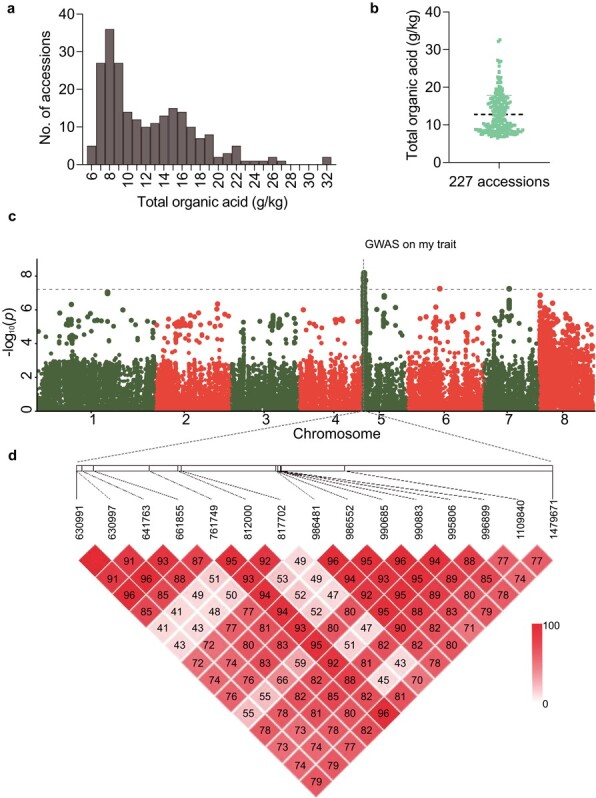
Figure 1.

GWAS identified QTLs associated with organic acid accumulation in peach fruit. a Distribution of fruit organic acid contents in the 227 accessions measured over three consecutive years (2013–2015). b Distribution of fruit organic acid contents in the 227 accessions used for GWAS. c Manhattan plot of the GWAS results for fruit organic acid content with a compressed MLM. The vertical axis presents negative log10-transformed P-values from the compressed MLM. The horizontal dashed line represents the Bonferroni significance threshold of GWAS. d LD plot of 15 significant association signals in a 0.85-Mb (0.63–1.48 Mb) interval on the top of chromosome 5. In each box, the color represents the relationship of LD and the number represents the value of LD multiplied by 100. Absence of a number from a box means the value of LD is 1.
