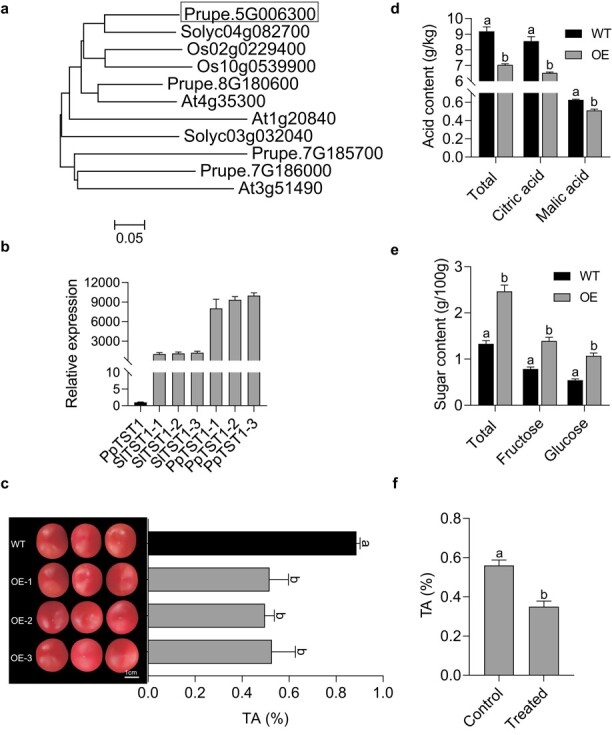
Figure 5.

Transgenic analysis. a Phylogenetic analysis of PpTST1 and the other three peach TST1 members, two tomato TST1 members, three Arabidopsis and two rice TST1 members using amino acid sequence alignment through the neighbor-joining method with MEGA 7.0. b Relative expression levels of PpTST1His and SlTST1 (Solyc04g082700) in ripe fruits from three transgenic tomato lines (-1, -2, -3) by qRT–PCR. SlActin (Solyc10g080500) was used as housekeeping gene. Gene expression was normalized against SlActin as an internal expression control. The WT was set at 1 to calculate the relative expression of transformants c Fruit TA values in PpTST1His transgenic tomato fruits and the WT. d Total and two main organic acid contents in PpTST1His transgenic tomato fruits and the WT. e Total and two main sugar contents in PpTST1His transgenic tomato fruits and the WT. f Fruit TA values in PpTST1His transgenic tomatoes treated with glucose injection and the control. Significant differences among cultivars are shown by different lowercase letters (P < .01, Student’s t-test). Error bars represents the standard error of three biological replicates.
