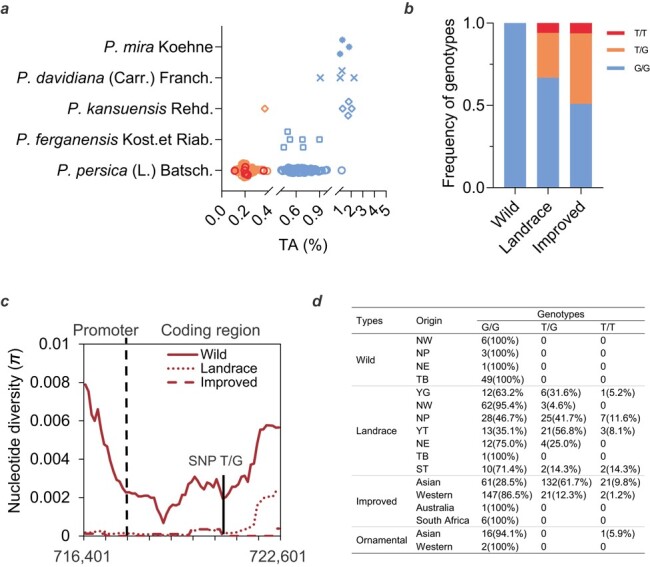
Figure 8.

Genotype and evolution analysis. a Distribution of fruit TA in five Prunus species assessed over three consecutive years (2013–2015). The two breaks in the X axis are 0.4 and 1% TA values, respectively. Blue, orange, and red colors represent G/G, T/G and T/T genotypes. b Frequency of three genotypes in wild, landrace, and improved groups. c Nucleotide diversity (π) distribution of the wild (red solid line), landrace (red dotted line), and improved (red dashed line) covering the promoter and coding region of PpTST1 within the 6.2-kb region. d Geographical distribution of 681 accessions based on genotyping with three genotypes of PpTST1. YG, Yun-Gui Plateau; NW, Northwest China; NP, North Plain China; YT, Yangtze River Middle and Backward; NE, Northeast China; TB, Tibet Plateau; ST, South China Subtropical [63].
