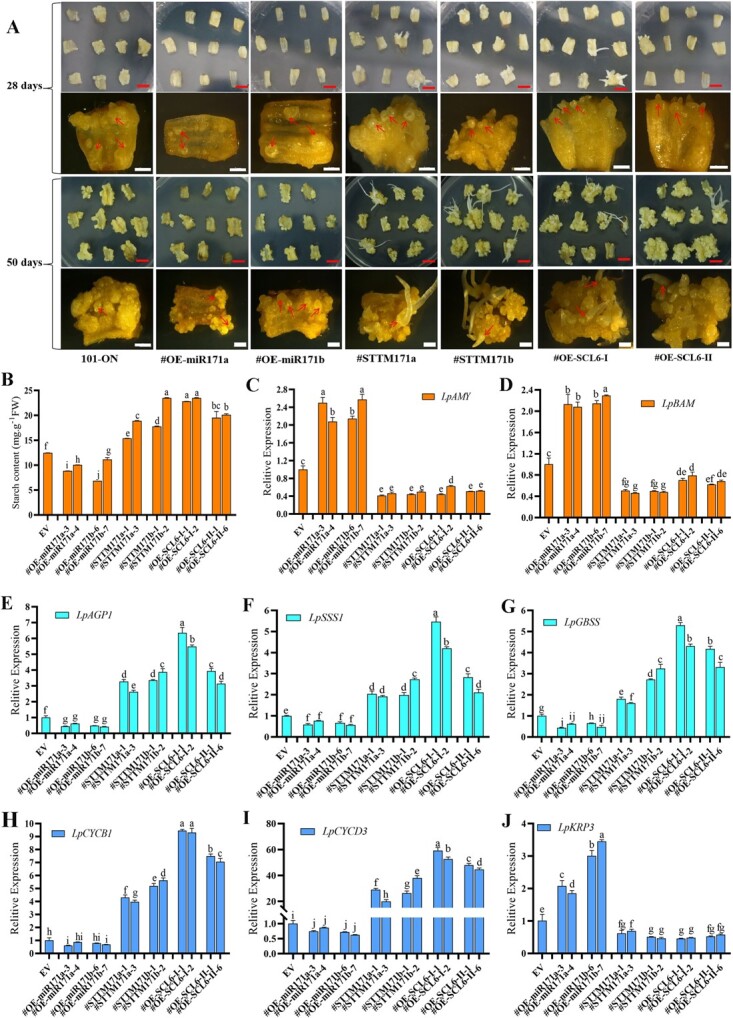
Figure 4.

Comparison of somatic embryo induction, tissue morphology observations, starch content determination, and related gene expression. a Growth status of scales at 28 and 50 days of induction. The top images are photographs, and the bottom images are micrographs. Red scale bars = 0.5 cm; white scale bars = 2 mm. Red arrows point to somatic embryos. b Determination of starch contents in different transgenic plants. c and d Expression levels of LpAMY and LpBAM, encoding key starch metabolism enzymes. e Expression level of LpAGP1, a key starch synthesis gene. f Expression level of LpSSS1, a key starch synthesis gene. g Starch synthase LpGBSS expression. h and i Expression of the key cell cycle genes LpCYCB1 and LpCYCD3. j Expression of the cell cycle inhibitor gene LpKRP3.
