Figure 6.

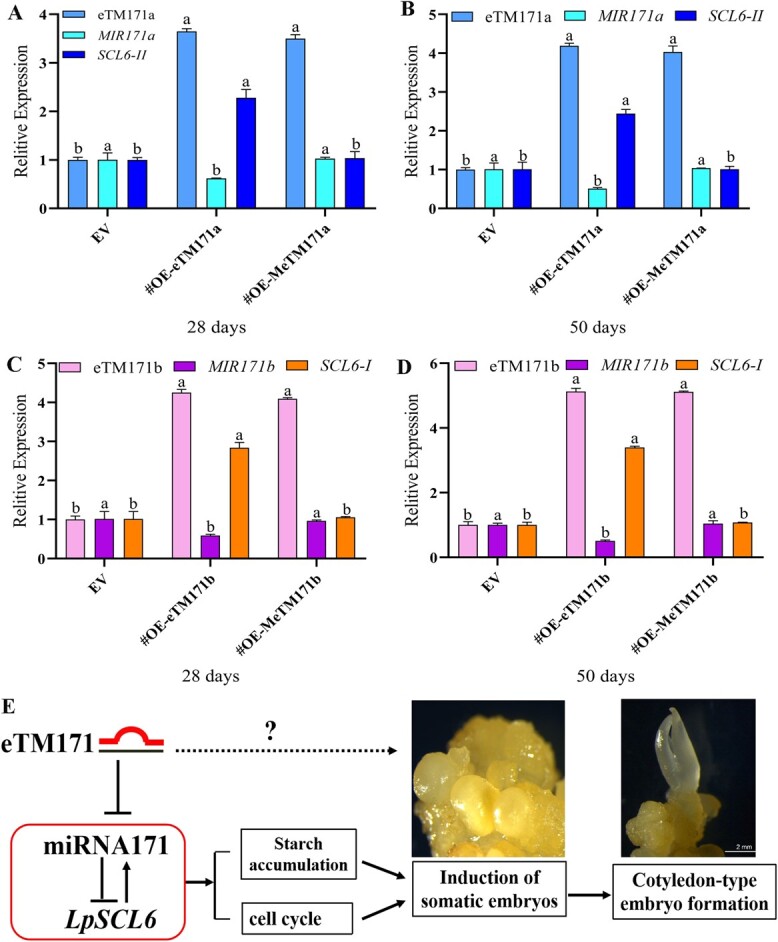
Hypothetical model of the eTM-miR171-SCL6 module regulating SE in L. pumilum. a and b Expression levels of MIR171a and LpSCL6-II on the 28th and 50th days of lpu-eTM171a overexpression and point mutant line somatic embryo induction. c and d Expression levels of MIR171b and LpSCL6-I on the 28th and 50th days of lpu-eTM171b overexpression and point mutant line somatic embryo induction. Different lower-case letters in a-d indicate significant differences (tested by ANOVA) with respect to the same gene in different transgenic lines as a group. e Hypothetical model of the eTM-miR171-SCL6 module regulating SE in L. pumilum. The solid and dotted arrows indicate positive regulation, and the inverted T-shape indicates negative regulation. The solid lines are the results obtained from the verification of this research, and the dotted lines are the results of speculation based on model plant research but not verified.
