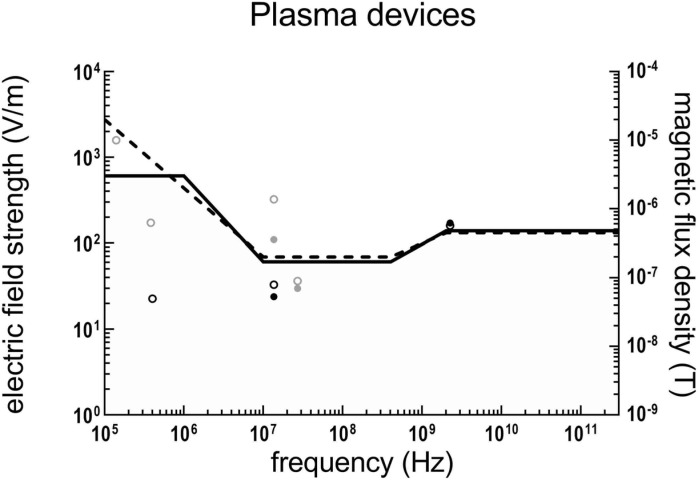
Fig. 3.
Maximum electric field strength (left y-axis) and magnetic flux density (right y-axis) at the worker’s position per publication, per main frequency component for plasma devices (plasma etching, plasma sputtering and vapour deposition).
Legend: ― = electric field action levels; --- = magnetic field action levels; ● = electric field strength; ○ = magnetic flux density. Symbols in grey represent data published before 2012 and symbols in black data published in or after 2012. Literature references used:40, 53, 54)

