Figure 1.

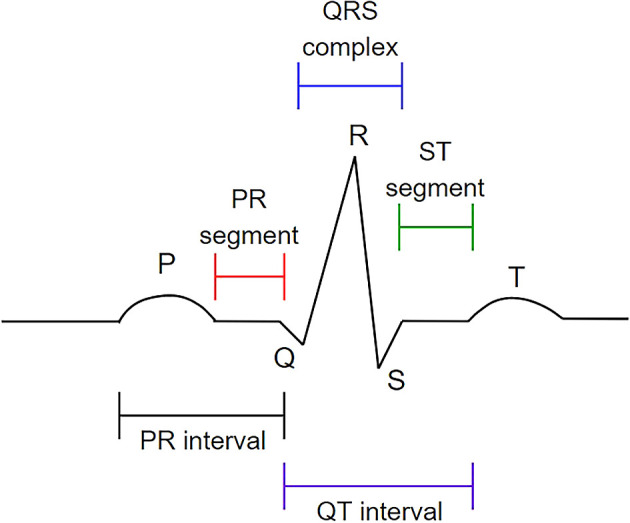
The P wave, QRS complex, and T wave in the standard electrocardiogram (ECG). This figure has been reproduced with permission from Ref. 7.

The P wave, QRS complex, and T wave in the standard electrocardiogram (ECG). This figure has been reproduced with permission from Ref. 7.