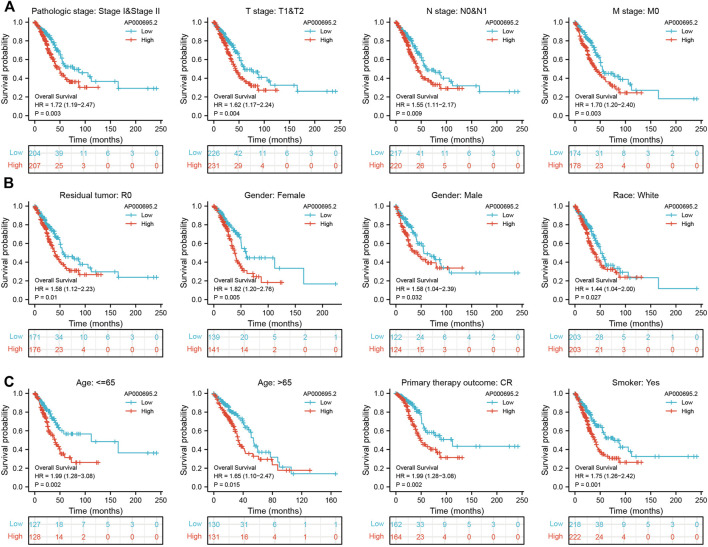
FIGURE 3.
Kaplan–Meier survival analyses for prognostic values of AP000695.2 in different subgroups stratified by clinical features. (A–C) Kaplan–Meier curves for overall survival of AP000695.2 in subgroups including stages I-II, T1-T2, N0-N1, M0, R0, female, male, race, white, age>65years, age <65years, CR, and smoker in TCGA-LUAD cohort.

