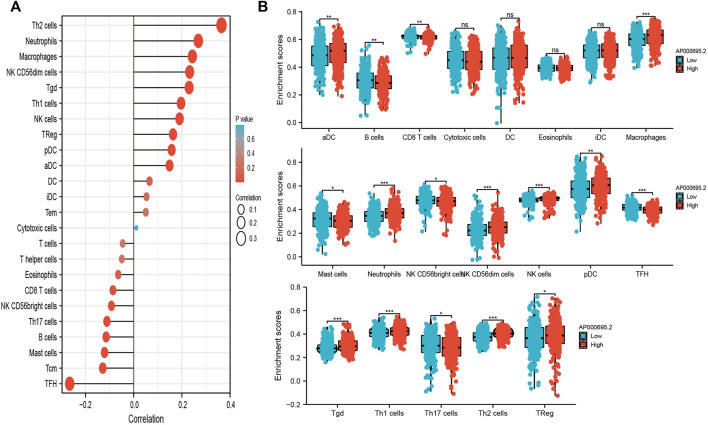
FIGURE 7.
Correlation analysis of lncRNA-AP000695.2 expression and infiltration levels of immune cells in LUAD tissues. (A) Correlation between the relative abundances of 24 immune cells and lncRNA AP000695.2 expression level. (B) Box plots of the correlations between lncRNA-AP000695.2 or molecular model expression and infiltration levels of immune cells. *p < 0.05, **p < 0.01, and ***p < 0.001.

