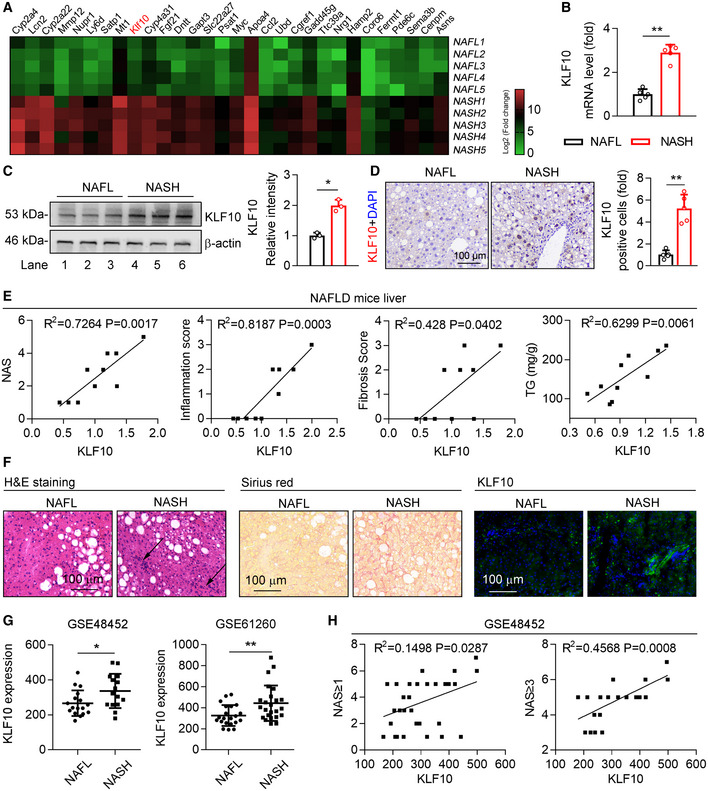
Figure 1. Hepatic KLF10 is induced in NASH mice and patients.

- Heatmap of genes in the livers of HFD‐feeding induced NAFL mice and WD/CCl4‐treatment induced NASH mice. n = 5. The color gradient represents log2 (Fold change).
- Relative mRNA levels of KLF10 in the livers from NAFL and NASH mice. n = 5.
- Protein levels of KLF10 examined by western blots (left) and its expression was normalized to the β‐actin (right). n = 3. Results represent three independent experiments.
- Representative immunohistochemistry of KLF10 protein expression in the liver sections from NAFL and NASH mice. The bar chart showed the fold change of KLF10 positive cells per field (NASH vs. NAFL). n = 5.
- Correlations between KLF10 and NAS, inflammation score, fibrosis scores, and hepatic triglyceride contents (TG) from NAFL mice (n = 7) and NASH mice (n = 8).
- H&E staining, Sirius red staining, and KLF10 immunofluorescence staining of liver sections from NAFL and NASH patients. n = 3.
- Spearman correlations between KLF10 expression and NAS in liver tissues from NAFL and NASH patients using GEO datasets (GSE48452). Left panel, n = 32 (including 17 NAFL patients and 15 NASH patients). Right panel, n = 21 (including 6 NAFL and 15 NASH patients).
Data information: *P < 0.05, **P < 0.01‐. Results are shown as mean ± SD. Student’s t‐test (B–D, G). Spearman’s correlation (E, H).
Source data are available online for this figure.
