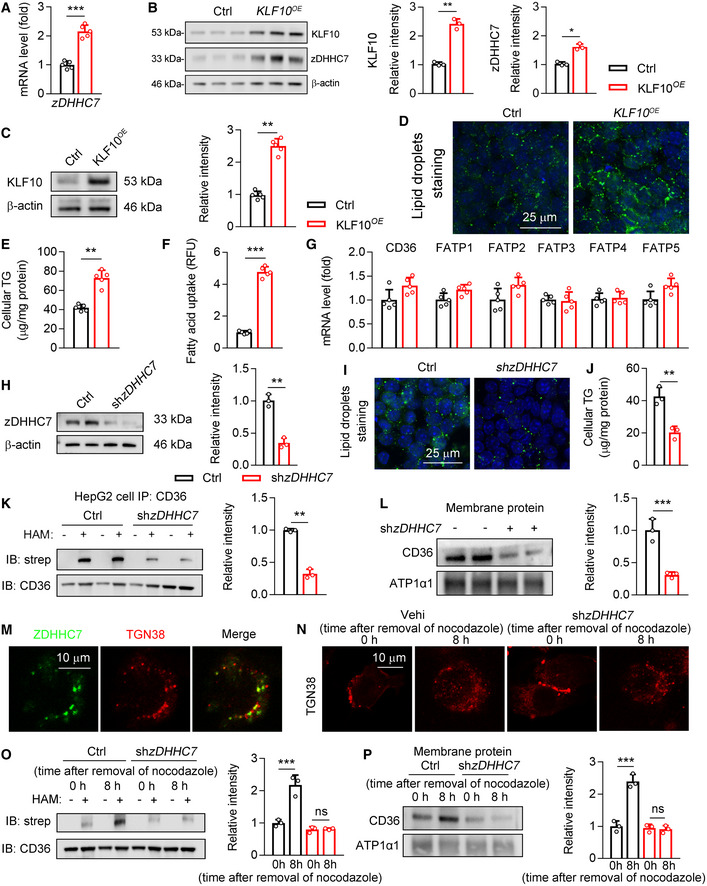
Figure EV2. The roles of KLF10 overexpression and zDHHC7 knockdown in cultured cells.

-
A, BHepG2 cells were transfected with lentivirus expressing KLF10 or negative control (Ctrl). n = 5 independent experiments. (A) Relative mRNA of zDHHC7. (B) Protein levels of KLF10 and zDHHC7, and their normalization to β‐actin.
-
C–GHepG2 cells were transfected with lentivirus expressing KLF10 or negative control (Ctrl). n = 5 independent experiments. (C) Protein levels of KLF10, and its normalization to β‐actin. (D) BODIPY staining for lipid droplets. (E) Cellular TG contents. (F) Fatty acids uptake assays. (G) Relative mRNA level of fatty acid transporters.
-
H–LHepG2 cells were treated with lentivirus expressing shRNA targeting zDHHC7 or negative control (Ctrl). n = 3 independent experiments. (H) Protein levels of zDHHC7, and its normalization to β‐actin. (I) BODIPY staining for lipid droplets in HepG2 cells. (J) Cellular TG contents. (K) Protein levels of palmitoylated CD36. (L) CD36 protein expression in the plasma membrane fractions, and its normalization to ATP1a1.
-
MRepresentative immunofluorescence staining of zDHHC7 and TGN38 in HepG2 cells.
-
N, OOn day 0, HepG2 cells were transduced with lentivirus expressing negative control (Ctrl) or shzDHHC7. On day 2, cells were treated with 1 mM nocodazole for 12 h. On day 3, cells were fixed or collected at 0 and 8 h after removal of nocodazole. n = 3. Results represent three independent experiments. (N) Immunofluorescence staining of TGN38 (red). (O) Protein levels of palmitoylated CD36 in HepG2 cells.
-
PCD36 protein expression in the plasma membrane fractions, and its normalization to ATP1a1. n = 3. Results represent three independent experiments.
Data information: **P < 0.01, ***P < 0.001. Results are shown as mean ± SD. Student’s t‐test (A–C, E–H, J–L). One‐way ANOVA (O, P).
Source data are available online for this figure.
