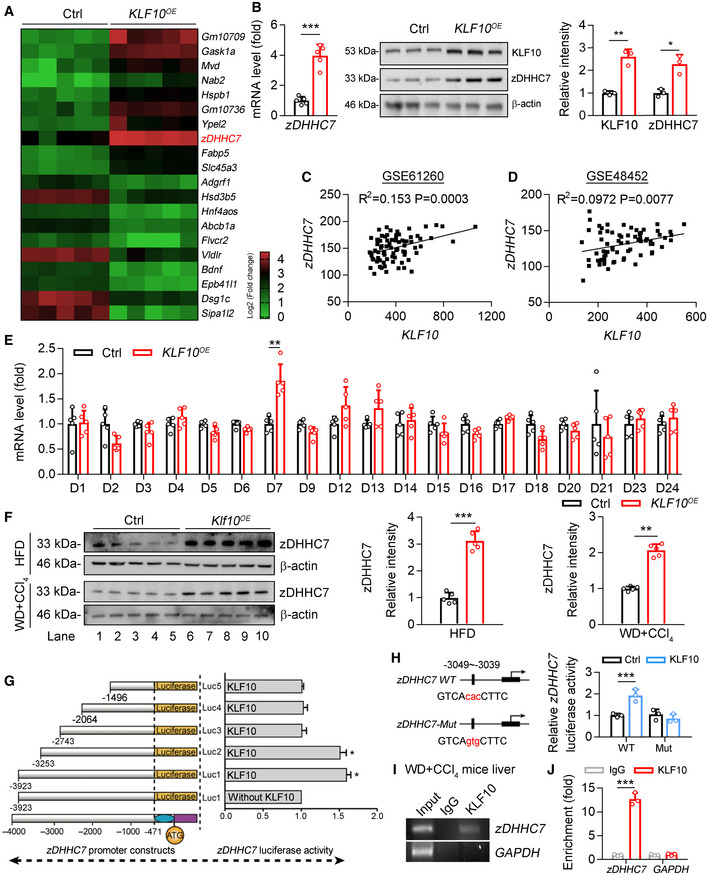
Figure 3. KLF10 transcriptionally activates zDHHC7 expression.

-
AHeatmap of genes in mouse primary hepatocytes transfected with lentivirus vectors expressing KLF10 (KLF10 OE ) or empty vector (Ctrl), P < 0.001. n = 5 per group. The color gradient represents log2 (Fold change).
-
BRelative mRNA (n = 5) and protein (n = 3) levels of zDHHC7 in MPHs expressing KLF10 or empty vector (Ctrl). The protein level of KLF10 or zDHHC7 was normalized to β‐actin. Results represent three independent experiments.
-
C, DSpearman correlations between KLF10 and zDHHC7 in liver tissues from NASH and NAFL patients using GEO datasets (GSE48452 and GSE61260). In the dataset GSE61260 (C), n = 83 (including 38 healthy controls, 21 NAFL patients, and 24 NASH patients). In the dataset GSE48452 (D), n = 73 (including 41 healthy controls, 17 NAFL patients, and 15 NASH patients).
-
ERelative mRNA levels of DHHCs family in HepG2 cells overexpressing KLF10 or empty vector (ctrl). n = 5. Results represent three independent experiments.
-
FProtein levels of zDHHC7 in the livers of HFD mice or WD/CCl4 mice as described in Fig 2. The protein level of zDHHC7 was normalized to the β‐actin. n = 5.
-
GLuciferase reporter assays showing the activity of different truncation of zDHHC7 promoter fragments in HepG2 cells. n = 3. Results represent three independent experiments.
-
HThe transcriptional activity of wild‐type or mutant zDHHC7 promoter in HepG2 cells. n = 3. Results represent three independent experiments.
-
IChromatin immunoprecipitation analysis of KLF10 binding activity at the zDHHC7 promoter. Soluble chromatin was prepared from the livers of WD/CCl4 treatment‐induced NASH mice and immunoprecipitated with antibodies against KLF10 or against IgG. The final DNA extractions were amplified using pairs of primers that cover the regions of zDHHC7 and GAPDH gene promoters.
-
JQuantitative real‐time RCR results of ChIP assays. IgG, immunoglobulin G. n = 3. Results represent three independent experiments.
Data information: *P < 0.05, **P < 0.01, ***P < 0.001. Results are shown as mean ± SD. Student’s t‐test (B, E, F, H, J). Spearman’s correlation (C, D).
Source data are available online for this figure.
