
Figure EV2. Protein expression during recovery from ethanol starvation.
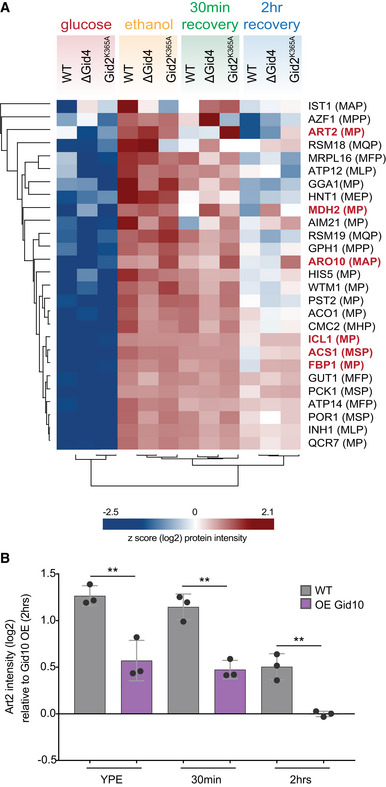
- Heat map of z‐scored abundances (log2) of the proteins which have the following criteria: (i) significantly upregulated in ethanol compared to glucose, (ii) significantly upregulated in ethanol compared to 2 h recovery, and (iii) contains a proline in position 2 or 3.
- Art2 protein abundance in wildtype and Gid10 overexpressing yeast strains grown in ethanol medium (YPE) for 19 h, and following 30 min and 2 h glucose recovery. Bars represent mean, error bars represent standard deviation, significance was determined by one‐way ANOVA (unpaired) followed by Tukey’s multiple comparison test,** indicates P < 0.01 (n = 3 biological replicates).