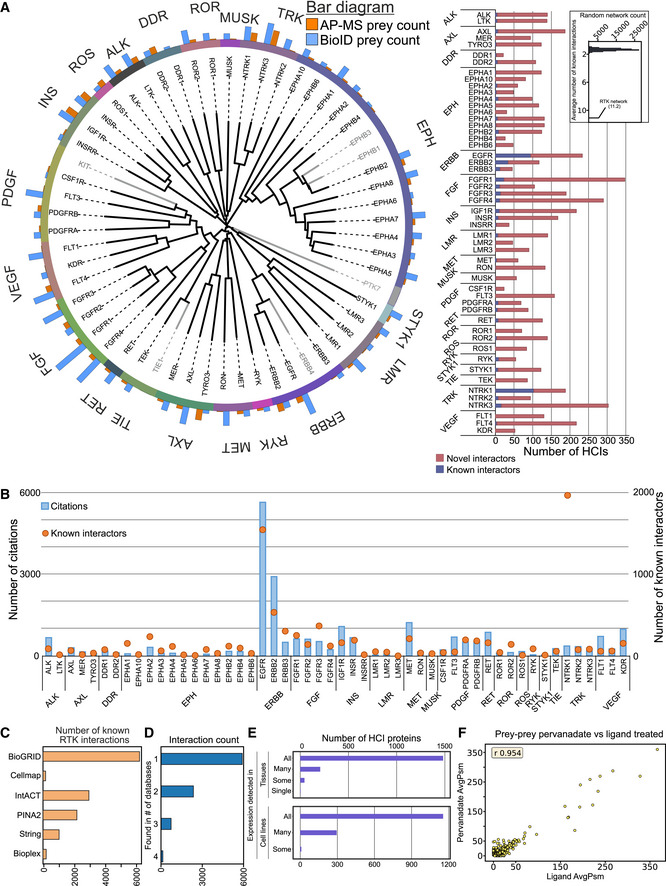
Figure 1. General assessment of study scope and interaction data landscape.

- Left: Sequence alignment tree of the receptor tyrosine kinase (RTK) family. Members of the 20 different receptor tyrosine kinase subfamilies are grouped according to their sequence (kinase domain) homology to their respective subfamilies, indicated by the unique colors. Gray color indicates RTKs not included in this study. Number of high‐confidence interactor (HCI) proteins identified in AP‐MS (orange) and BioID (blue) experiments are indicated above the circle. Right: Comparison of the detected interactions to existing knowledge. The number of HCIs detected in this study are divided to reported interactions reported in at least one of the databases used for mapping known interactions (blue), and novel interactions (red). Inset: Average number of known protein–protein interactions in 100,000 randomly generated networks of identical topology, as the RTK network generated during this study. The average number of known interactions per bait for the RTK network is annotated with a pointer. Interactions reported here represent both AP‐MS and BioID results. For both of these methods, two biological replicates were analyzed.
- Number of citations and known interactors per RTK, which are grouped into their respective subfamilies. Citations are shown in blue bars and plotted against the Y‐axis on the left, while known interactors are shown with orange bubbles, and the right axis. Citations were mapped from NCBI gene2pubmed data.
- Number of known RTK interactors from each of the databases used for the known set. For all known interaction analyses of this study, the six different databases were merged into one dataset.
- Known RTK interactors grouped based on how many of the six used databases they were seen in. No interactors were seen in five or more databases, and most were only seen in one.
- Expression of identified HCI proteins in tissues (top) and cell lines (bottom) from human protein atlas (Uhlén et al, 2015). Detected in all: expression detected in all available tissues or cell lines; detected in many; detected in at least a third of the tissues/cell lines; detected in some; detected in more than one, but fewer than a third of the tissues/cell lines.
- Average peptide spectrum match (AvgPsm) comparison between pervanadate (Y‐axis) and ligand (X‐axis) treated samples for 8 RTKs. Correlation coefficient was calculated using Pearson r method of the SciPy stats package.
