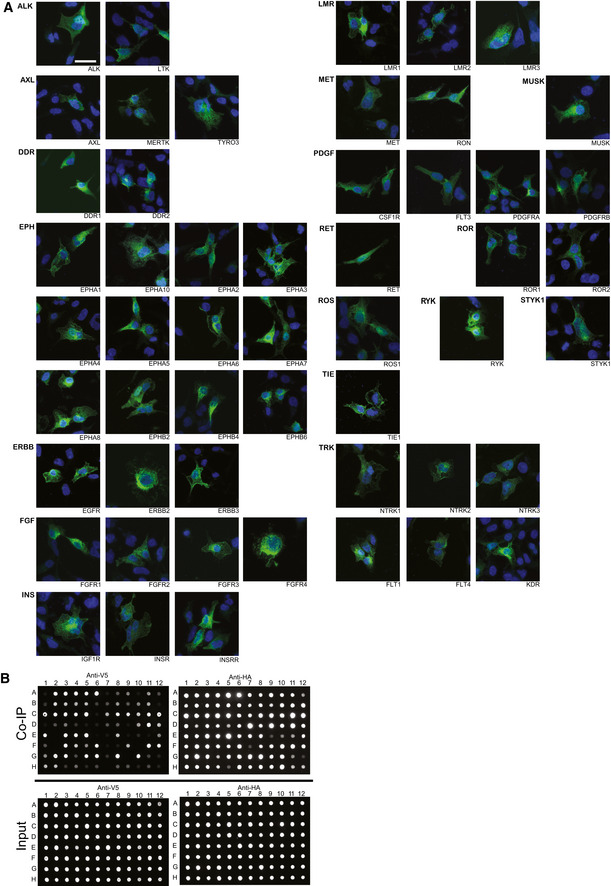
Figure EV2. RTK localization and AP‐MS validation via CO‐IP.

- Immunofluorescence microscopy images of each bait RTK. Images are divided based on the RTK subfamily. Green: Anti‐HA, Blue: DAPI. Scale bar 10 µm.
- Verification of several AP‐MS high‐confidence interactions with Co‐IP and dot blot. 83 interactions were tested, of which 69 were detected via Co‐IP. The prey proteins were tagged with Strep‐HA, and bait proteins with V5 and coexpressed in HEK293 cells. For negative controls, Strep‐HA‐tagged GFP and V5‐tagged RTKs were used. The Strep‐HA tagged proteins were immunoprecipitated with Strep‐Tactin sepharose. The immunoprecipitated protein complexes were then dot blotted with anti‐V5 and anti‐HA antibodies.
