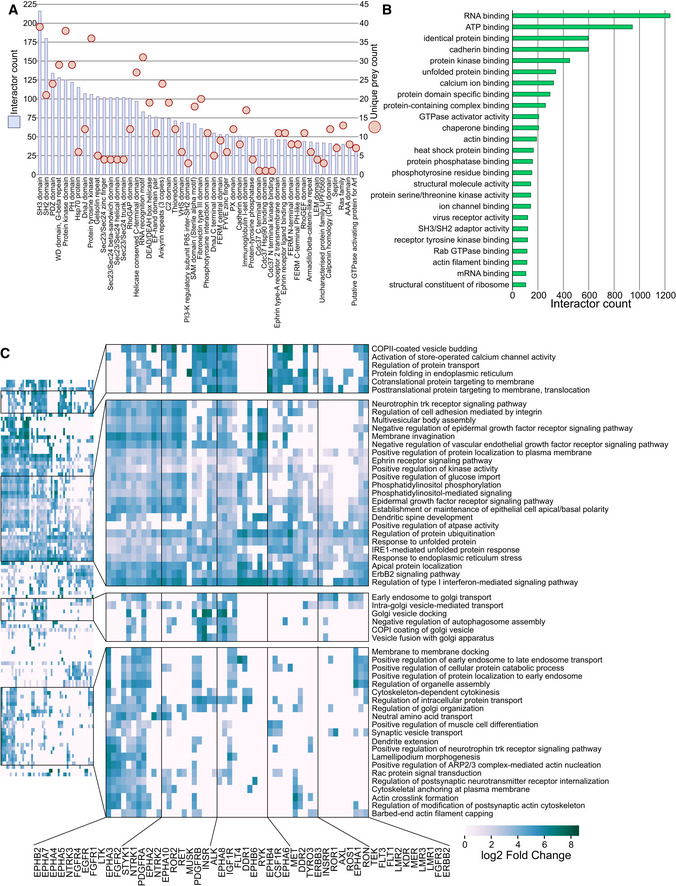
Figure 3. Characterization of RTK interactor proteins.

- Identified protein domains of the RTK interactors mapped from Pfam. Blue bars (left Y‐axis) denote the cumulative count of the corresponding domain, while light red circles (right Y‐axis) denote the count of unique prey proteins with the domain (i.e., SH3 domain was encountered 216 times in the data, but in 39 unique proteins, while SH2 domain was identified 180 in 21 unique HCIs).
- Significantly enriched (q < 0.05, calculated with Fisher exact test and Benjamini–Hochberg multiple‐testing correction) GO “molecular function” annotations in the RTK interactors.
- Significantly enriched signaling pathways (reactome) identified in each RTK interactome. Fold change values were calculated using the human UniProt as the reference. Values are shown in log2 scale, and negative values were filtered out. A q‐value cutoff of 0.05 was used to identify significant fold changes (calculated using Fisher exact test with Benjamini–Hochberg correction)
