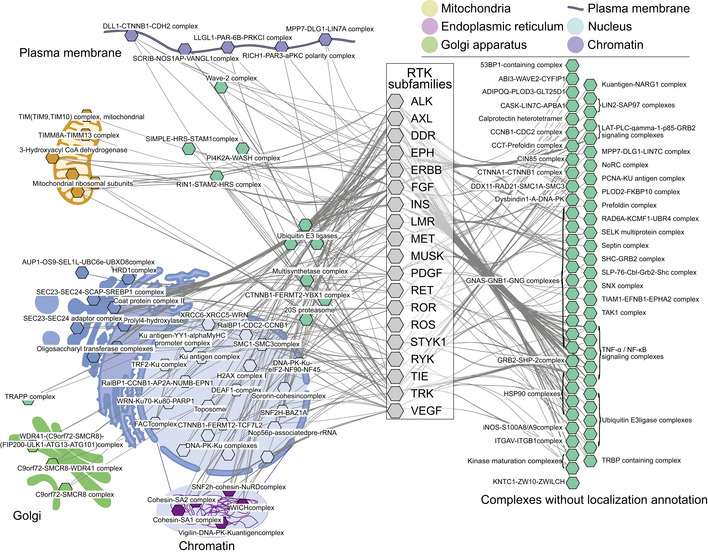
Figure EV4. Enriched complexes in the RTK interactome data.

Significantly (q < 0.05, calculated with Fisher exact test followed by Benjamini–Hochberg multiple‐testing correction) enriched CORUM complexes in the interactomes of the RTK subfamilies. The cellular localization was assigned to each complex with available GO cellular component in CORUM. Connections from subfamilies to complexes denote significant enrichment of the complex with one or more members of the subfamily. On the right side, complexes without localization information are grouped based on their protein composition.
