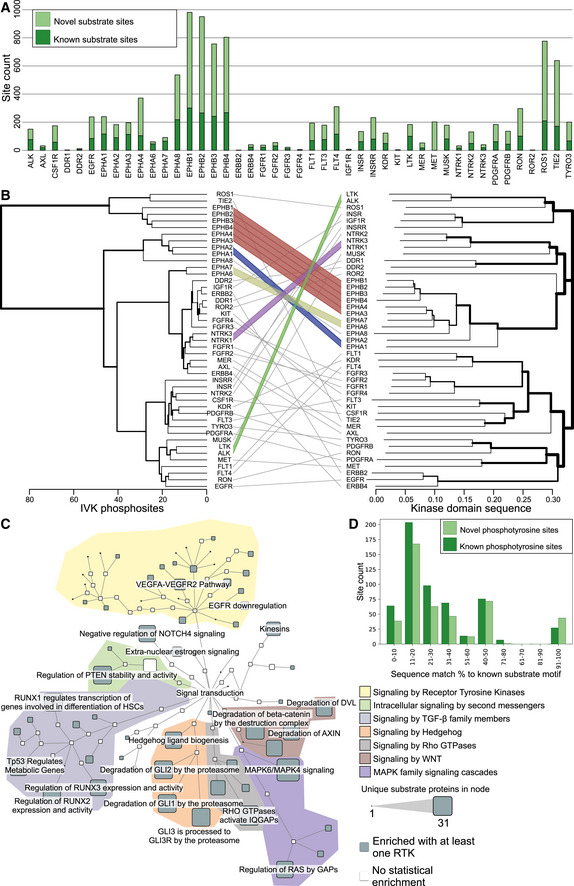
Figure 5. Characterization of RTK‐specific phosphotyrosine sites.

- Number of phosphotyrosine sites identified in the IVK assay after filtering. Deeper shade of green corresponds to previously identified kinase‐substrate relationships.
- Dendrograms of RTK clustering based on phosphosite identifications (left) compared to Clustal Omega clustering based on protein kinase domain sequence of the same RTKs (right). Colored lines denote baits in the same order in both clustering approaches. Clustering based on phosphosites was performed using the ward.D2 method from the R stats package.
- Statistically enriched (q < 0.05, calculated with Fisher exact test and Benjamini–Hochberg multiple‐testing correction) reactome terms in the identified RTK substrates. Size of the node corresponds to the number of unique substrates in the node, and nodes without significant enrichment are shaded white. Only subnodes of the signal transduction root node are shown. Colored areas denote different signaling pathway trees.
- Substrate site amino acid sequence compared to known phosphorylation motifs from human protein reference database (Peri et al, 2003). Data presented represent only the receptors, for which motifs were available in the database.
