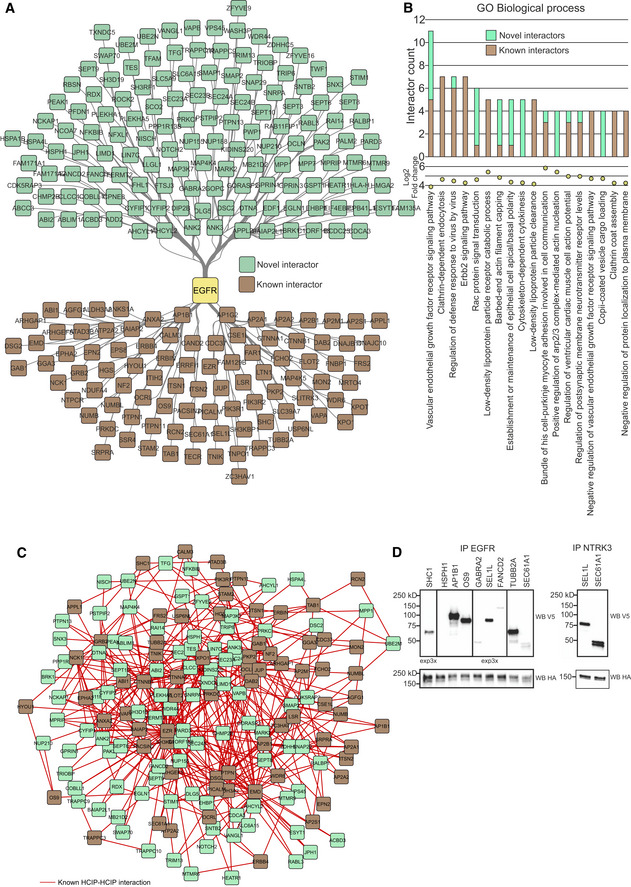
Figure EV5. Analysis of EGFR interactome generated in this study.

- EGFR HCIs identified in the study. Previously known interactors are denoted in brown, and novel in green.
- Most common significantly (q < 0.05, calculated with Fisher exact test and Benjamini–Hochberg multiple‐testing correction) enriched GO Biological process annotation terms in the EGFR HCIs. The top chart shows unique protein counts, while the lower chart depicts log2 fold change over expected value calculated from the background set.
- Known interactions between previously known HCIs and novel HCIs.
- Co‐IP validation of a subgroup of EGFR (left) and NTRK3 (right) interactors.
Source data are available online for this figure.
