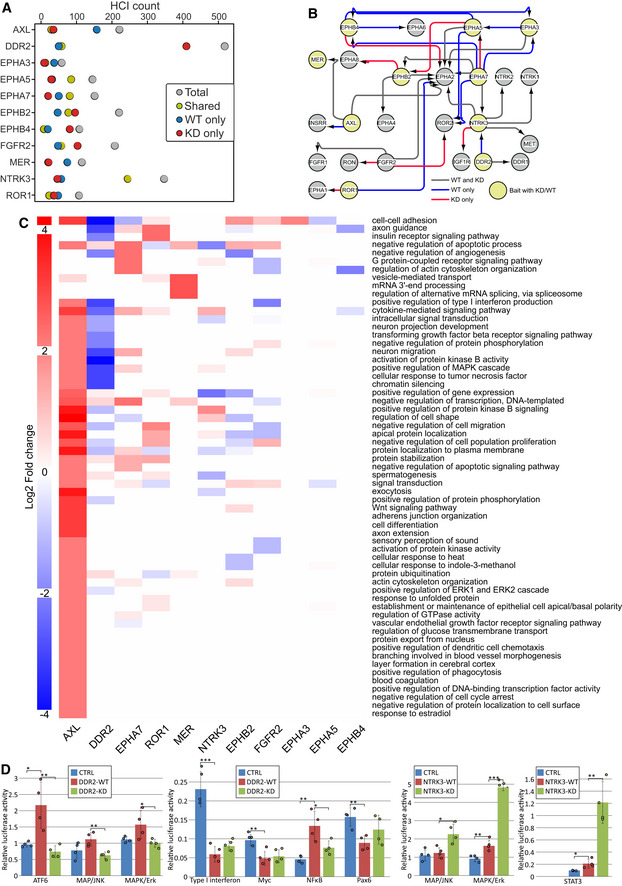
Figure 6. Assessment of differences in wild‐type (WT) and kinase dead RTK mutants.

- HCI counts per WT / KD pair. Total HCI number is shown in gray, while number of shared HCI proteins is in yellow, WT only HCIs in blue, and KD only HCIs in red.
- Bait–bait interactions of the WT / KD baits. Shown are all RTKs found in WT/KD HCI data, but interactions are shown only for those with WT and KD constructs. Gray arrows depict preserved interactions, while blue ones are interactions that are lost in KD data, and red denotes interactions only seen in KD data.
- GO biological process change in KD data. Values are log2 fold change in KD compared to WT, where positive values reflect higher representation in KD data.
- Comparison of effects of DDR2 and NTRK3 WT and KD on activity of cellular signaling pathways. Luciferase assays were used with either WT or KD RTKs to identify transcription‐level changes caused by the lack of kinase activity of the KD mutant. *P < 0.05, **P < 0.01, ***P < 0.001; P‐values were calculated using t‐test. Error bars denote standard deviation, and each data point (n = 4, biological replicates) is shown as a separate dot.
