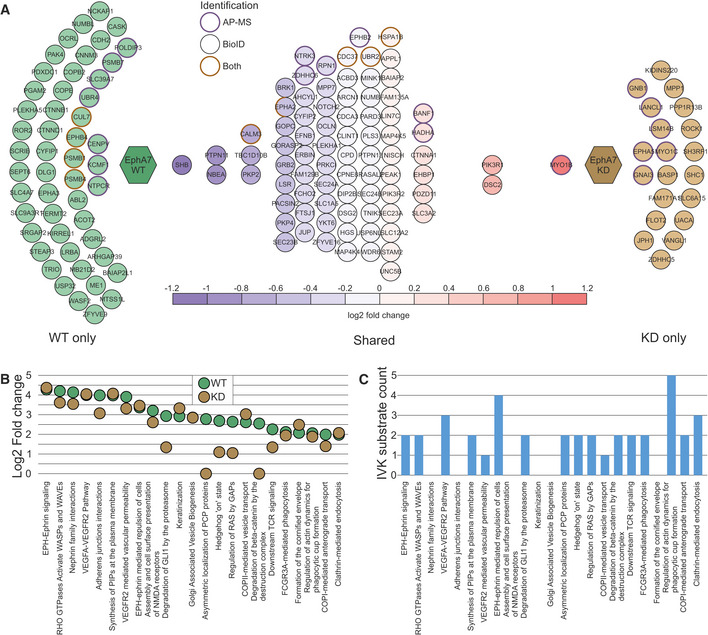
EphA7 WT (left) and KD (right) HCIs. Shared HCIs are in the middle arranged according to log2 fold change values. HCIs identified in AP‐MS are marked with a violet rim, BioID with black rim, and orange rim marks HCIs detected with both approaches. For the shared interactors, a bait‐normalized fold change value was calculated. Three HCIs, CDC37, UBR2, and HSPA1B, were identified in both WT and KD experiments with both AP‐MS and BioID methods. For these, the fold change values in the different experimental approaches were within 0.1 of each other, and thus the value used was an average of both. EphA2 was detected via AP‐MS and BioID with WT EphA7, and with only BioID with KD EphA7.

