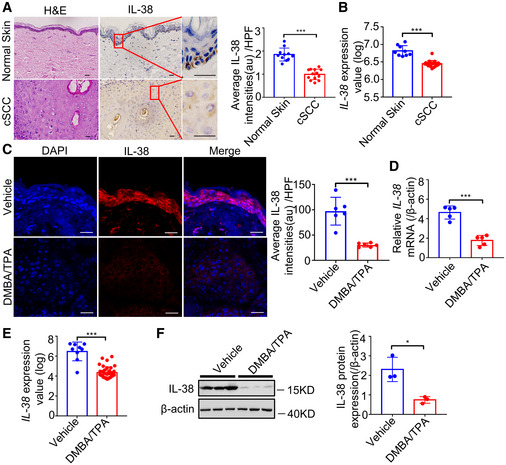
Figure 1. IL‐38 is closely related to the occurrence and development of skin tumors.

-
ARepresentative micrographs of human skin sections stained with hematoxylin‐eosin (H&E) (left) and anti‐IL‐38 antibody (right) from normal patients (n = 11) and tumors of cSCC patients (n = 13). Scale bars represent 100 μm. The graph shows the quantification of mean IL‐38 expression per high‐powered field in tissues.
-
BRelative expression of IL‐38 in human normal tissues (n = 9) and cSCC (n = 18) was analyzed using Geo Datasets (GSE98767).
-
C, DThe dorsal hair of normal C57/BL6 mice was shaved and treated with DMBA/TPA twice a week for 32 weeks to induce skin tumors. (C) Representative micrographs of mouse normal skin (n = 6) and tumor (n = 6) sections stained with anti‐IL‐38 antibody. The graph shows the quantification of mean IL‐38 expression per high‐powered field in tissues. Scale bars represent 100 μm. (D) Relative expression levels of Il‐38 in normal skin (n = 5) and tumors (n = 5) of mice were quantified using qPCR.
-
ERelative expression levels of Il‐38 in normal tissues (n = 9) and cSCC tissues (n = 38) of mice were analyzed using Geo Datasets (GSE63967).
-
FRepresentative western blot bands indicating IL‐38 in mouse normal skin (n = 3) and DMBA/TPA‐induced tumors (n = 3). The graph shows the quantification of mean IL‐38 expression in tissues.
Data information: Error bars represent the mean ± SD. All data are biological replicates. *P < 0.05; **P < 0.01; ***P < 0.001; P values were calculated using Student’s t‐test.
