
Figure EV2. Construction and identification of keratinocytes IL‐38‐specific knockout mice and effect of keratinocyte‐specific IL‐38 deficiency on epidermal barrier.
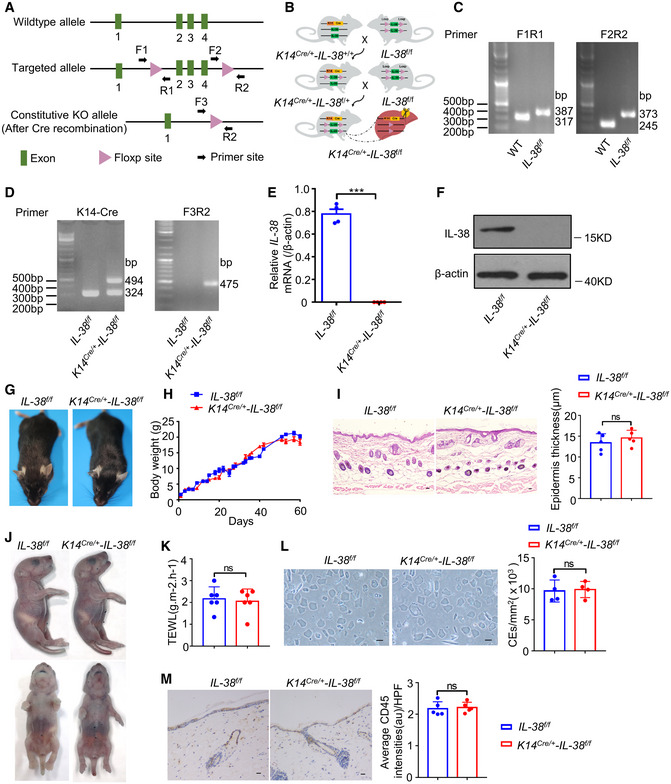
- Construction of Il‐38‐loxP (Il‐38f / f ) mice.
- Typical genetic cross scheme of keratinocyte IL‐38‐specific knockout (K14Cre /+ ‐Il‐38f / f ) mice.
- PCR analysis of WT mice (at 317 and 245 bp) and Il‐38‐loxP mice (at 387 and 373 bp).
- PCR analysis of keratin 14 promoter directing expression of Cre recombinase(left) and deletion of IL‐38 (right).
- Relative expression of IL‐38 in the epidermal splits of Il‐38f / f (n = 4) and K14Cre /+ ‐Il‐38f / f (n = 4) mice.
- Representative western blot bands indicating IL‐38 in the epidermal splits of Il‐38f / f and K14Cre /+ ‐Il‐38f / f mice.
- Appearance of Il‐38f / f and K14Cre /+ ‐Il‐38f / f mice.
- Cumulative body weight changes in Il‐38f / f (n = 12) and K14Cre /+ ‐Il‐38f / f (n = 12) mice in 60 days.
- Representative histological photographs of skin stained with hematoxylin‐eosin (H&E) from Il‐38f / f (n = 5) and K14Cre /+ ‐Il‐38f / f (n = 5) mice. Scale bars represent 100 μm. The graph shows the quantification of epidermal thickness.
- Skin barrier‐dependent dye exclusion assay using toluidine blue in Il‐38f / f mice (n = 5) and K14Cre /+ ‐Il‐38f / f littermate (n = 5) at birth.
- TEWL assay measured on ventral surface of newborn Il‐38f / f mice (n = 6) and K14Cre /+ ‐Il‐38f / f littermate (n = 6).
- Representative micrographs of cornified cell envelopes from Il‐38f / f (n = 4) and K14Cre /+ ‐Il‐38f / f (n = 4) mice. Scale bars represent 100 μm. The graph shows the number of cornified cell envelopes per square millimeter.
- Representative immunohistochemical staining micrographs of CD45 in the skin of Il‐38f / f (n = 5) and K14Cre /+ ‐Il‐38f / f (n = 5) mice. Scale bars represent 100 μm. The graph shows average intensities of CD45 per high‐powered field.
Data information: Error bars represent the mean ± SD. All data are biological replicates. ns, not significant; *P < 0.05; **P < 0.01; ***P < 0.001; P values were calculated using Student’s t‐test.