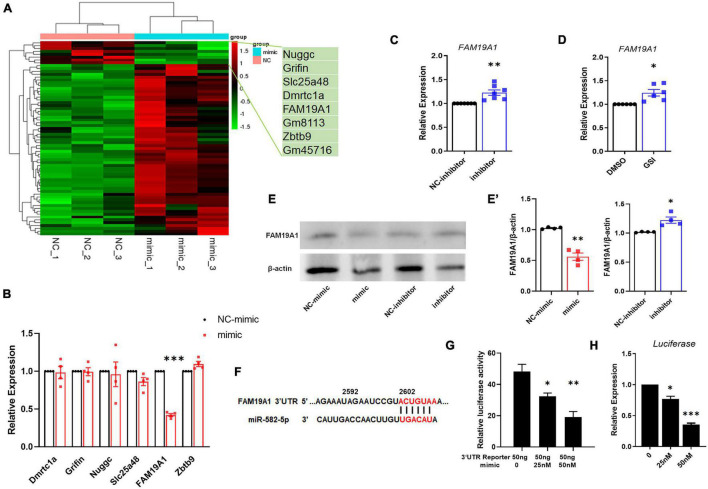
FIGURE 4.
miR-582-5p down-regulates the expression of FAM19A1. (A) RNA-seq of miR-582-5p mimic and NC-mimic transfected NSCs, n = 3. (B) The mRNA expression of potential target genes in the mimic and NC-mimic group, with FAM19A1 down-regulated, n = 4. (C) RT-qPCR analysis of FAM19A1 in the inhibitor and NC-inhibitor group, n = 7. (D) RT-qPCR analysis of FAM19A1 in the GSI and control DMSO group, n = 6. (E,E’) Western blotting and statistics of FAM19A1 in the mimic/inhibitor and control group, n = 4. (F) The sequence of the FAM19A1 3′UTR and the binding site of miR-582-5p (red font). (G) The relative luciferase activity of the FAM19A1 3′UTR reporter with the increase of miR-582-5p concentration, n = 3. One-way ANOVA with Dunnett’s test. (H) The expression of firefly luciferase mRNA with the increase of miR-582-5p concentration, n = 4. One-way ANOVA with Dunnett’s test. For statistical analysis, *p < 0.05, **p < 0.01, ***p < 0.001, compared with the control, respectively.

