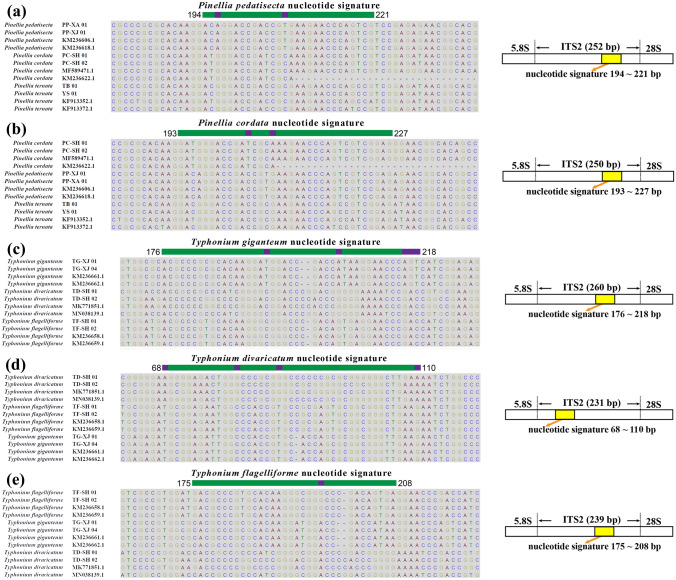
Fig. 1.
ITS2 sequence alignment and SNPs of Pinellia pedatisecta (a), P. cordata (b), Typhonium giganteum (c), T. divaricatum (d) and T. flagelliforme (e).The highlighted regions represent the nucleotide signature and the marked bases represent the SNP sites of each signature, while the lines represent alignment gaps

