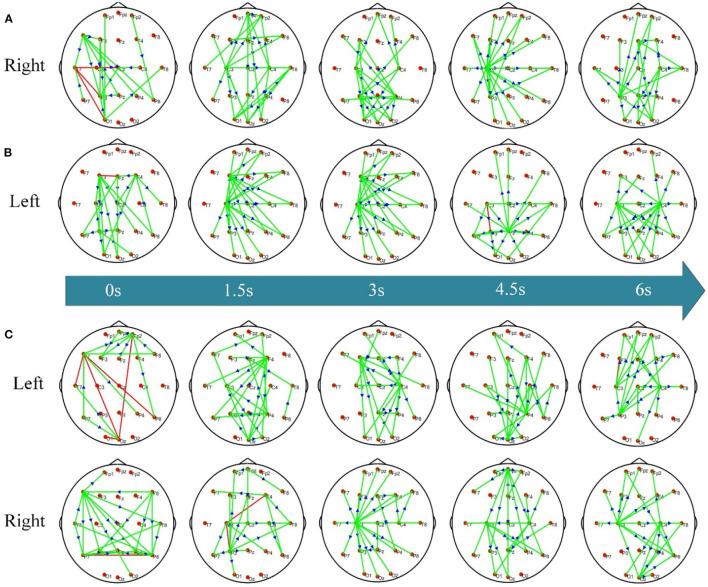
Figure 3.
The dynamic KMI network patterns of RS/LS/HC. (A) Time-varying network pattern in the right hand of the RS group; (B) time-varying network pattern of the left hand in LS group; (C) time-varying network pattern of left/right hand in HC group. The connecting edge in the figure represents the coupling relationship between the two electrodes, the red edge represents the two-way connection between the two nodes, the green edge represents the one-way connection between the nodes, and the arrow represents the flow direction between them.

