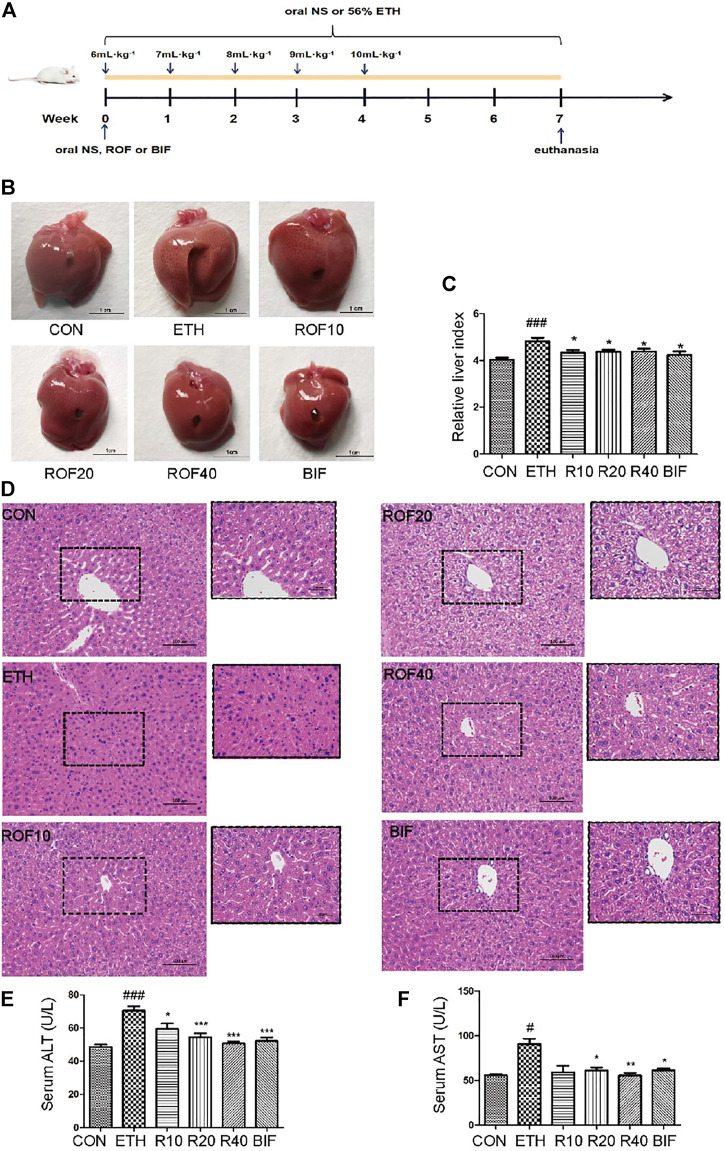
FIGURE 1.
Effects of ROF on histopathological changes and hepatic index in ALD mice. The time flowchart is shown in (A). Macroscopic appearance of liver tissues (B) and hepatic index (C). (D) Histopathology analysis of liver damage (200× and 400×). The serum concentrations of ALT (E) and AST (F). Mean ± SEM (n = 6–9). *p < 0.05, **p < 0.01 and ***p < 0.001 vs. the ETH group. ##p < 0.01 and ###p < 0.001 vs. the CON group.

