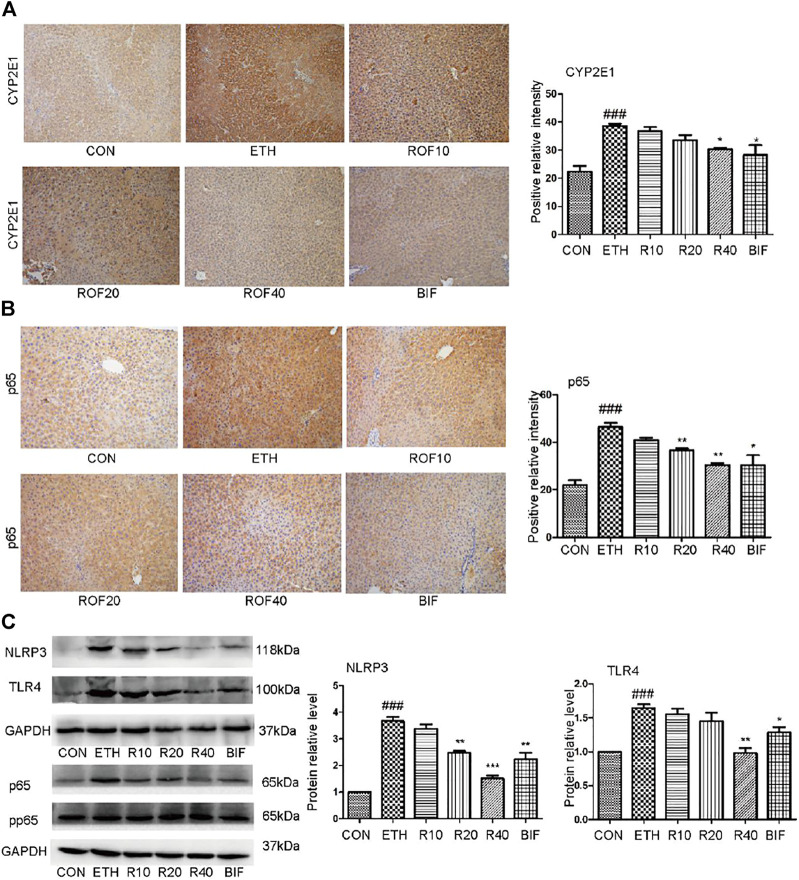
FIGURE 3.
Effect of ROF on CYP2E1 protein and TLR4/NF-κB axis in mice. The expression of CYP2E1 (A) and p65 (B) in the liver tissues detected by immunohistochemical staining (×200 magnification ). The protein levels of NLRP3, TLR4, and pp65 were detected by Western blotting (C). Mean ± SEM (n = 3). *p < 0.05, **p < 0.01 and ***p < 0.001 vs. the ETH group. ##p < 0.01 vs. the CON group.

