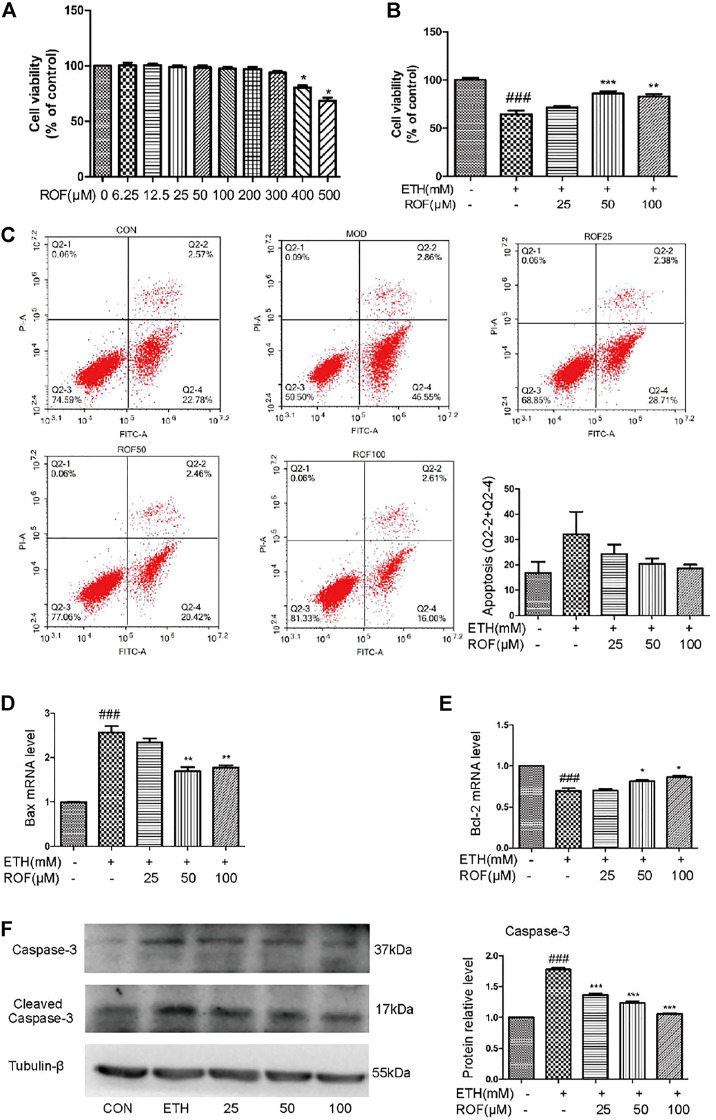
FIGURE 4.
Effects of ROF on cell apoptosis and viability: (A,B) Cell viability of ETH (200 mm) and ETH + ROF groups after treatment for 24 h. The apoptotic rate (C), Bax expression (D), and Bcl-2 expression (E) in LO2 cells. The protein levels of caspase 3 and cleaved caspase 3 (F). Mean ± SEM (n = 3–6). *p < 0.05, **p < 0.01 and ***p < 0.001 vs. the ETH group. ###p < 0.001 vs. the CON group.

