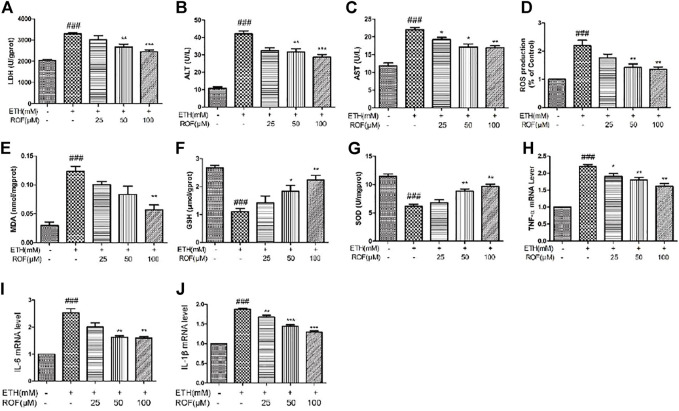
FIGURE 5.
Effect of ROF on the production of LDH (A), ALT (B), AST (C), ROS (D), MDA (E), GSH (F), and SOD (G) in ETH-treated hepatocytes. The cells were exposed to ETH (200 mm) and ETH + ROF (25, 50, 100 μM) for 24 h. The expression levels of TNF-α (H), IL-6 (I), and IL-1β (J) in LO2 cells. Mean ± SEM (n = 3–4). *p < 0.05, **p < 0.01, and ***p < 0.001 vs. the ETH group. ##p < 0.01 and ###p < 0.001 vs. the CON group.

