Fig. 2.
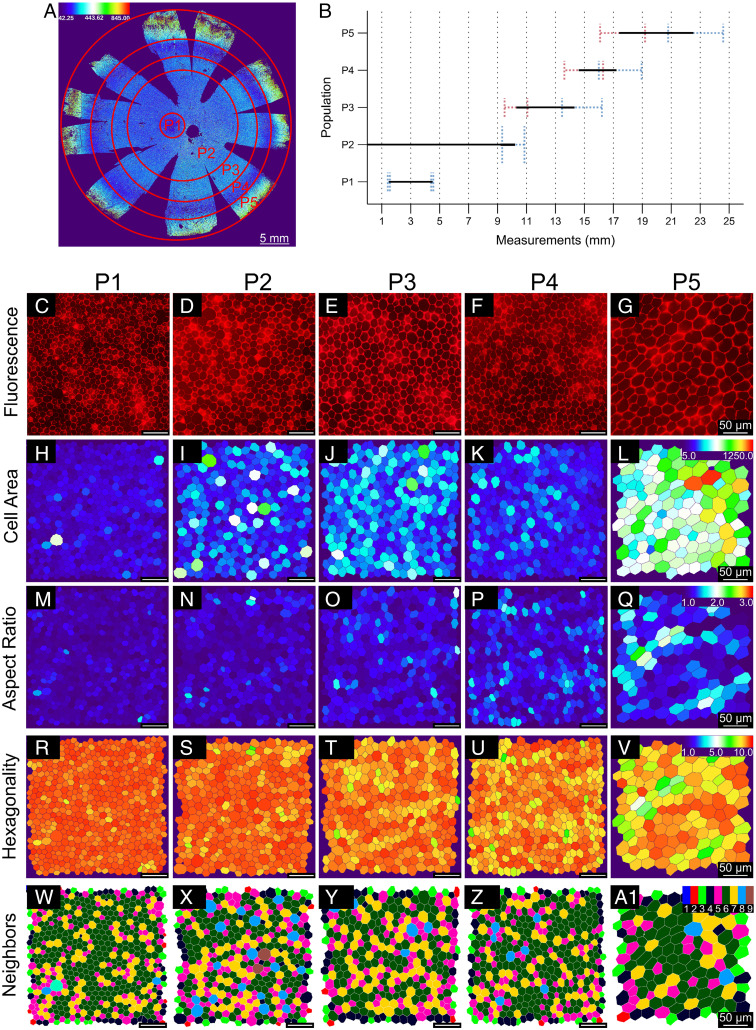
Analysis of cell area revealed the presence of five morphometrically different RPE subpopulations in human cadaver eyes. (A) A custom-made software called REShAPE Selection Tool divided segmented color-coded RPE flatmount images into five subpopulations arranged in concentric rings based on differences in cell area, from the center toward the periphery. (B) The graph describes the distance of each RPE subpopulation from the center of the eye in millimeters. Line boundaries represent the averages and the SDs calculated from the radii of the cropped circles (red corresponds to the SD of measurements of inner radii and blue to measurements of outer radii). (C–A1) The panel shows zoomed-in representative images of cells for each RPE subpopulation (P1 to P5). (C–G) Correspond to phalloidin (red)-stained images. (H–A1) Illustrate border-segmented images color coded for cell area (H–L), AR; (M–Q), hexagonality (R–V), and neighbors (W–A1) for all five RPE subpopulations. Heatmap scale for cell area (range, 50 to 1,250 µm2) is shown on top-right corner of L, for AR (range 1 to 3 arbitrary units) on top-right corner of Q, for hexagonality (range, 1 to 10 arbitrary units) on top-right corner of V, and for neighbors (range, 1 to 9) on top-right corner of A1.

