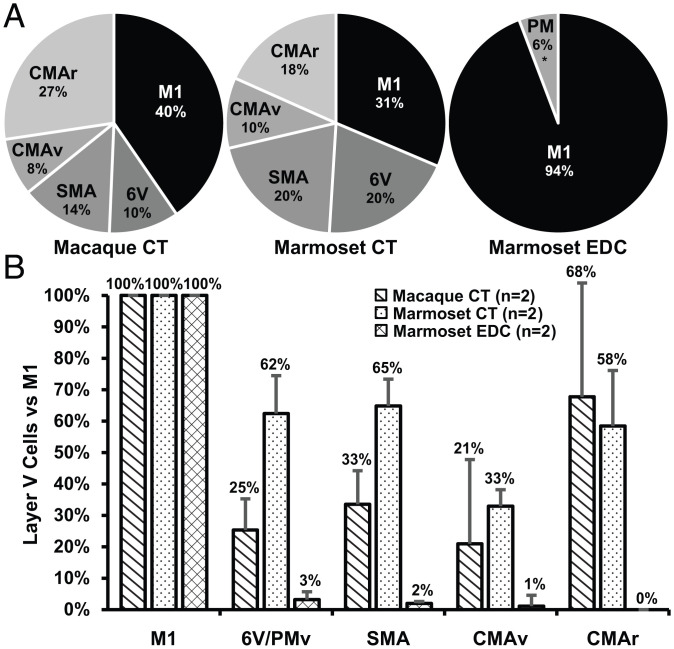
Fig. 3.
Quantitative analysis of cortical outputs to the motoneurons of a laryngeal (CT) and a hand (EDC) muscle in macaques and marmosets. (A) Percentage of infected neurons in layer V within each of the cortical motor areas following retrograde transneuronal transport of rabies virus from the CT and EDC muscles of macaques and marmosets. (B) The number of infected neurons in layer V within each of the cortical motor areas is normalized to that found in M1 of each animal. The error bars represent the SD of the results from n = 2 for each experiment.

