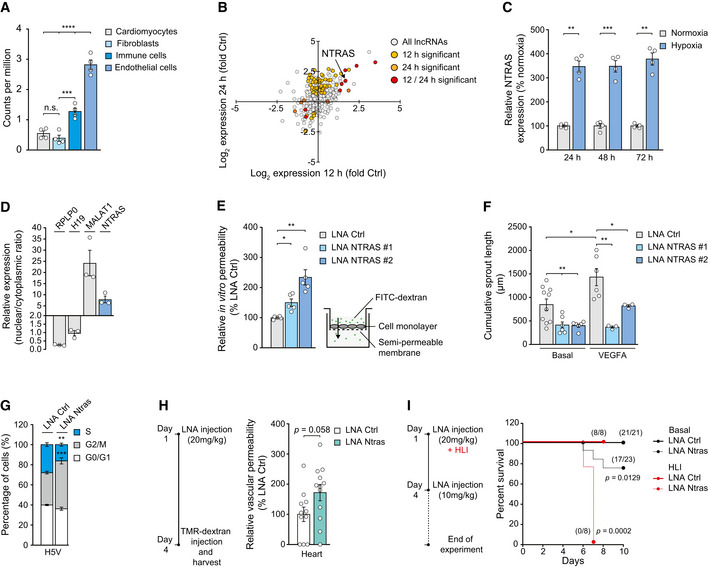
Figure 1. NTRAS is essential for normal endothelial cell function and vital in vivo .

- Validation of hypoxia‐induced NTRAS expression at the indicated time points by RT–qPCR (n = 4 independent biological replicates).
- Subcellular localization of NTRAS and control transcripts, assayed by nuclear‐cytoplasmic fractionation of HUVECs and RT–qPCR (n = 3 independent biological replicates).
- FITC‐dextran‐based in vitro permeability comparing control and NTRAS‐silenced HUVECs (n = 5 independent biological replicates).
- Cumulative in vitro sprout lengths of control and NTRAS‐silenced HUVECs under basal conditions and VEGFA stimulation (n = 3–10 independent biological replicates).
- Cell cycle analysis in Ntras‐silenced H5V cells (n = 3 independent biological replicates).
- TMR‐dextran‐based assessment of vascular permeability in vivo, comparing heart homogenates from control and Ntras‐silenced mice. Data normalized to organ and body weight (n = 11–12 mice per group). Experimental outline on the left.
- Survival of control and Ntras‐silenced mice under basal conditions (black, n = 21–23 mice per group) and in hind limb ischemia (HLI; red, n = 8 mice per group). Number of survivors is indicated; experimental outline on the left.
Data information: In (A, C–H) data are represented as mean ± SEM. n.s.: non‐significant, *P < 0.05, **P < 0.01, ***P < 0.001, ****P < 0.0001. (A) One‐way ANOVA, (C–E, H) two‐tailed unpaired t‐test, (G) two‐way ANOVA, and (I) Mantel‐Cox‐test.
Source data are available online for this figure.
